W&B integrations make it fast and easy to set up experiment tracking and data versioning inside existing projects. Check out integrations for ML frameworks such as PyTorch, ML libraries such as Hugging Face, or cloud services such as Amazon SageMaker.
Open AI
Hugging Face
Keras
PyTorch
PyG
PyTorch Lightning
Amazon SageMaker
Scikit-Learn
SpaCy
Ray tune
XGBoost
YOLO
1 - Add wandb to any library
Add wandb to any library
This guide provides best practices on how to integrate W&B into your Python library to get powerful Experiment Tracking, GPU and System Monitoring, Model Checkpointing, and more for your own library.
If you are still learning how to use W&B, we recommend exploring the other W&B Guides in these docs, such as Experiment Tracking, before reading further.
Below we cover best tips and best practices when the codebase you are working on is more complicated than a single Python training script or Jupyter notebook. The topics covered are:
Setup requirements
User Login
Starting a wandb Run
Defining a Run Config
Logging to W&B
Distributed Training
Model Checkpointing and More
Hyper-parameter tuning
Advanced Integrations
Setup requirements
Before you get started, decide whether or not to require W&B in your library’s dependencies:
Require W&B on installation
Add the W&B Python library (wandb) to your dependencies file, for example, in your requirements.txt file:
torch==1.8.0...wandb==0.13.*
Make W&B optional on installation
There are two ways to make the W&B SDK (wandb) optional:
A. Raise an error when a user tries to use wandb functionality without installing it manually and show an appropriate error message:
try:
import wandb
exceptImportError:
raiseImportError(
"You are trying to use wandb which is not currently installed.""Please install it using pip install wandb" )
B. Add wandb as an optional dependency to your pyproject.toml file, if you are building a Python package:
[project]
name = "my_awesome_lib"version = "0.1.0"dependencies = [
"torch",
"sklearn"]
[project.optional-dependencies]
dev = [
"wandb"]
User login
Create an API key
An API key authenticates a client or machine to W&B. You can generate an API key from your user profile.
For a more streamlined approach, you can generate an API key by going directly to the W&B authorization page. Copy the displayed API key and save it in a secure location such as a password manager.
Click your user profile icon in the upper right corner.
Select User Settings, then scroll to the API Keys section.
Click Reveal. Copy the displayed API key. To hide the API key, reload the page.
If a user is using wandb for the first time without following any of the steps mentioned above, they will automatically be prompted to log in when your script calls wandb.init.
Start a run
A W&B Run is a unit of computation logged by W&B. Typically, you associate a single W&B Run per training experiment.
Initialize W&B and start a Run within your code with:
run = wandb.init()
Optionally, you can provide a name for their project, or let the user set it themselves with parameters such as wandb_project in your code along with the username or team name, such as wandb_entity, for the entity parameter:
run = wandb.init(project=wandb_project, entity=wandb_entity)
You must call run.finish() to finish the run. If this works with your integration’s design, use the run as a context manager:
# When this block exits, it calls run.finish() automatically.# If it exits due to an exception, it uses run.finish(exit_code=1) which# marks the run as failed.with wandb.init() as run:
...
When to call wandb.init?
Your library should create W&B Run as early as possible because any output in your console, including error messages, is logged as part of the W&B Run. This makes debugging easier.
Use wandb as an optional dependency
If you want to make wandb optional when your users use your library, you can either:
Define a wandb flag such as:
trainer = my_trainer(..., use_wandb=True)
python train.py ... --use-wandb
Or, set wandb to be disabled in wandb.init:
wandb.init(mode="disabled")
export WANDB_MODE=disabled
or
wandb disabled
Or, set wandb to be offline - note this will still run wandb, it just won’t try and communicate back to W&B over the internet:
export WANDB_MODE=offline
or
os.environ['WANDB_MODE'] ='offline'
wandb offline
Define a run config
With a wandb run config, you can provide metadata about your model, dataset, and so on when you create a W&B Run. You can use this information to compare different experiments and quickly understand the main differences.
Typical config parameters you can log include:
Model name, version, architecture parameters, etc.
Dataset name, version, number of train/val examples, etc.
Training parameters such as learning rate, batch size, optimizer, etc.
The following code snippet shows how to log a config:
Use wandb.Run.config.update to update the config. Updating your configuration dictionary is useful when parameters are obtained after the dictionary was defined. For example, you might want to add a model’s parameters after the model is instantiated.
Create a dictionary where the key value is the name of the metric. Pass this dictionary object to run.log:
for epoch in range(NUM_EPOCHS):
    for input, ground_truth in data:
        prediction = model(input)
        loss = loss_fn(prediction, ground_truth)
        metrics = { "loss": loss }
        run.log(metrics)
If you have a lot of metrics, you can have them automatically grouped in the UI by using prefixes in the metric name, such as train/... and val/.... This will create separate sections in your W&B Workspace for your training and validation metrics, or other metric types you’d like to separate:
If you perform multiple calls to run.log for the same training step, the wandb SDK increments an internal step counter for each call to run.log. This counter may not align with the training step in your training loop.
To avoid this situation, define your x-axis step explicitly with run.define_metric, one time, immediately after you call wandb.init:
with wandb.init(...) as run:
    run.define_metric("*", step_metric="global_step")
The glob pattern, *, means that every metric will use global_step as the x-axis in your charts. If you only want certain metrics to be logged against global_step, you can specify them instead:
Now, log your metrics, your step metric, and your global_step each time you call run.log:
for step, (input, ground_truth) in enumerate(data):
    ...
    run.log({"global_step": step, "train/loss": 0.1})
    run.log({"global_step": step, "eval/loss": 0.2})
If you do not have access to the independent step variable, for example “global_step” is not available during your validation loop, the previously logged value for “global_step” is automatically used by wandb. In this case, ensure you log an initial value for the metric so it has been defined when it’s needed.
Log images, tables, audio, and more
In addition to metrics, you can log plots, histograms, tables, text, and media such as images, videos, audios, 3D, and more.
Some considerations when logging data include:
How often should the metric be logged? Should it be optional?
What type of data could be helpful in visualizing?
For images, you can log sample predictions, segmentation masks, etc., to see the evolution over time.
For text, you can log tables of sample predictions for later exploration.
See the logging guide for media, objects, plots, and more.
Distributed training
For frameworks supporting distributed environments, you can adapt any of the following workflows:
Detect which is the “main” process and only use wandb there. Any required data coming from other processes must be routed to the main process first. (This workflow is encouraged).
Call wandb in every process and auto-group them by giving them all the same unique group name.
If your framework uses or produces models or datasets, you can log them for full traceability and have wandb automatically monitor your entire pipeline through W&B Artifacts.
When using Artifacts, it might be useful but not necessary to let your users define:
The ability to log model checkpoints or datasets (in case you want to make it optional).
The path/reference of the artifact being used as input, if any. For example, user/project/artifact.
The frequency for logging Artifacts.
Log model checkpoints
You can log Model Checkpoints to W&B. It is useful to leverage the unique wandb Run ID to name output Model Checkpoints to differentiate them between Runs. You can also add useful metadata. In addition, you can also add aliases to each model as shown below:
metadata = {"eval/accuracy": 0.8, "train/steps": 800}
artifact = wandb.Artifact(
name=f"model-{run.id}",
metadata=metadata,
type="model" )
artifact.add_dir("output_model") # local directory where the model weights are storedaliases = ["best", "epoch_10"]
run.log_artifact(artifact, aliases=aliases)
You can log output Artifacts at any frequency (for example, every epoch, every 500 steps, and so on) and they are automatically versioned.
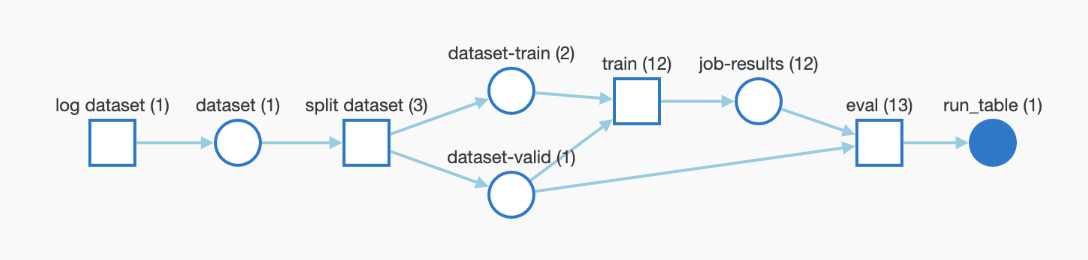
Log and track pre-trained models or datasets
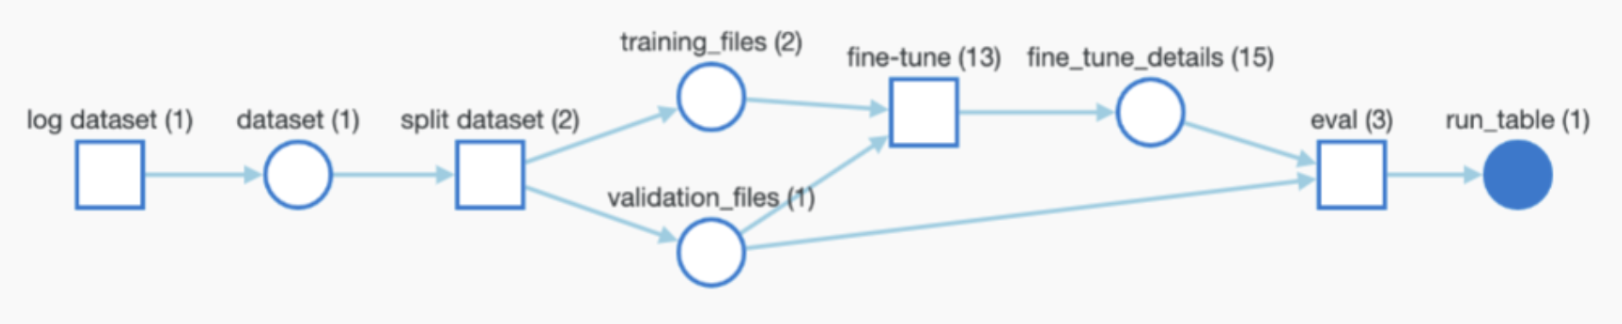
You can log artifacts that are used as inputs to your training such as pre-trained models or datasets. The following snippet demonstrates how to log an Artifact and add it as an input to the ongoing Run as shown in the graph above.
Artifacts can be found in the Artifacts section of W&B and can be referenced with aliases generated automatically (latest, v2, v3) or manually when logging (best_accuracy, etc.).
To download an Artifact without creating a wandb run (through wandb.init), for example in distributed environments or for simple inference, you can instead reference the artifact with the wandb API:
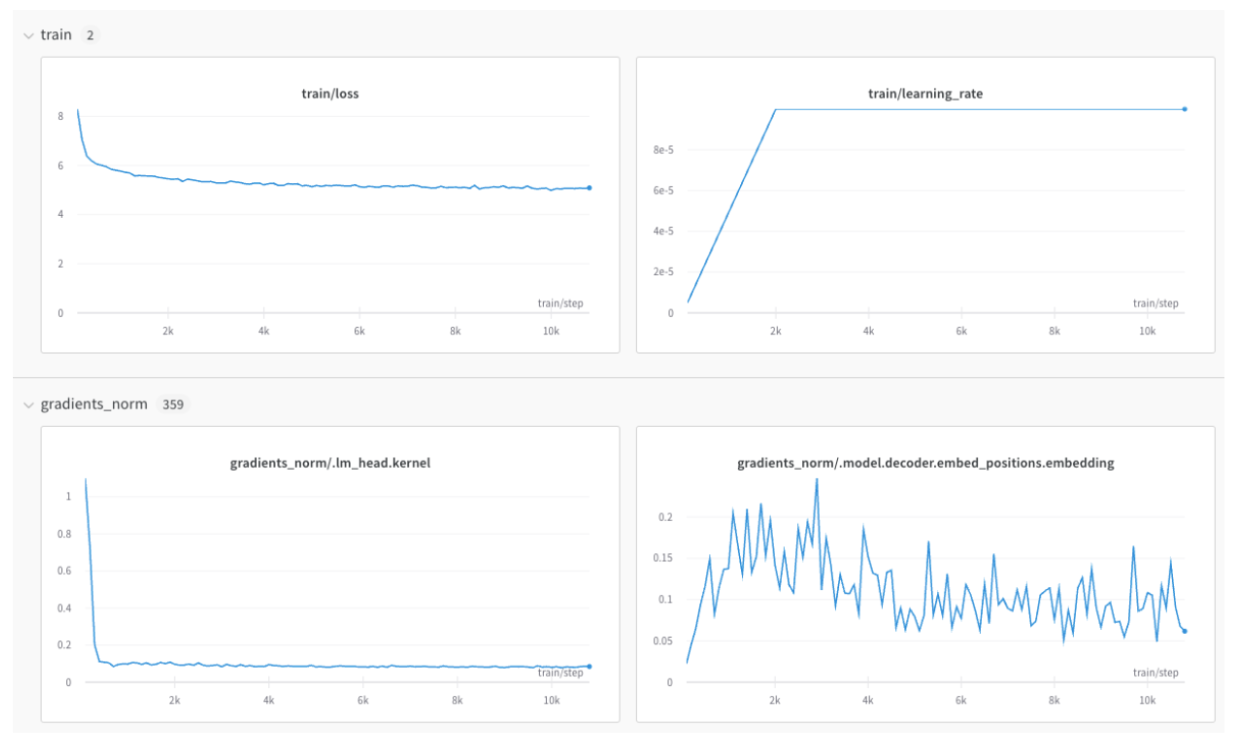
For DSPy optimizers that use dspy.Evaluate (such as MIPROv2), use the WandbDSPyCallback to log evaluation metrics over time and track program signature evolution in W&B Tables.
import dspy
from dspy.datasets import MATH
import weave
import wandb
from wandb.integration.dspy import WandbDSPyCallback
# Initialize W&B (importing weave is sufficient; no explicit weave.init needed)project_name ="dspy-optimization"wandb.init(project=project_name)
# Add W&B callback to DSPydspy.settings.callbacks.append(WandbDSPyCallback())
# Configure language modelsteacher_lm = dspy.LM('openai/gpt-4o', max_tokens=2000, cache=True)
student_lm = dspy.LM('openai/gpt-4o-mini', max_tokens=2000)
dspy.configure(lm=student_lm)
# Load dataset and define programdataset = MATH(subset='algebra')
program = dspy.ChainOfThought("question -> answer")
# Configure and run optimizeroptimizer = dspy.MIPROv2(
metric=dataset.metric,
auto="light",
num_threads=24,
teacher_settings=dict(lm=teacher_lm),
prompt_model=student_lm
)
optimized_program = optimizer.compile(
program,
trainset=dataset.train,
max_bootstrapped_demos=2,
max_labeled_demos=2)
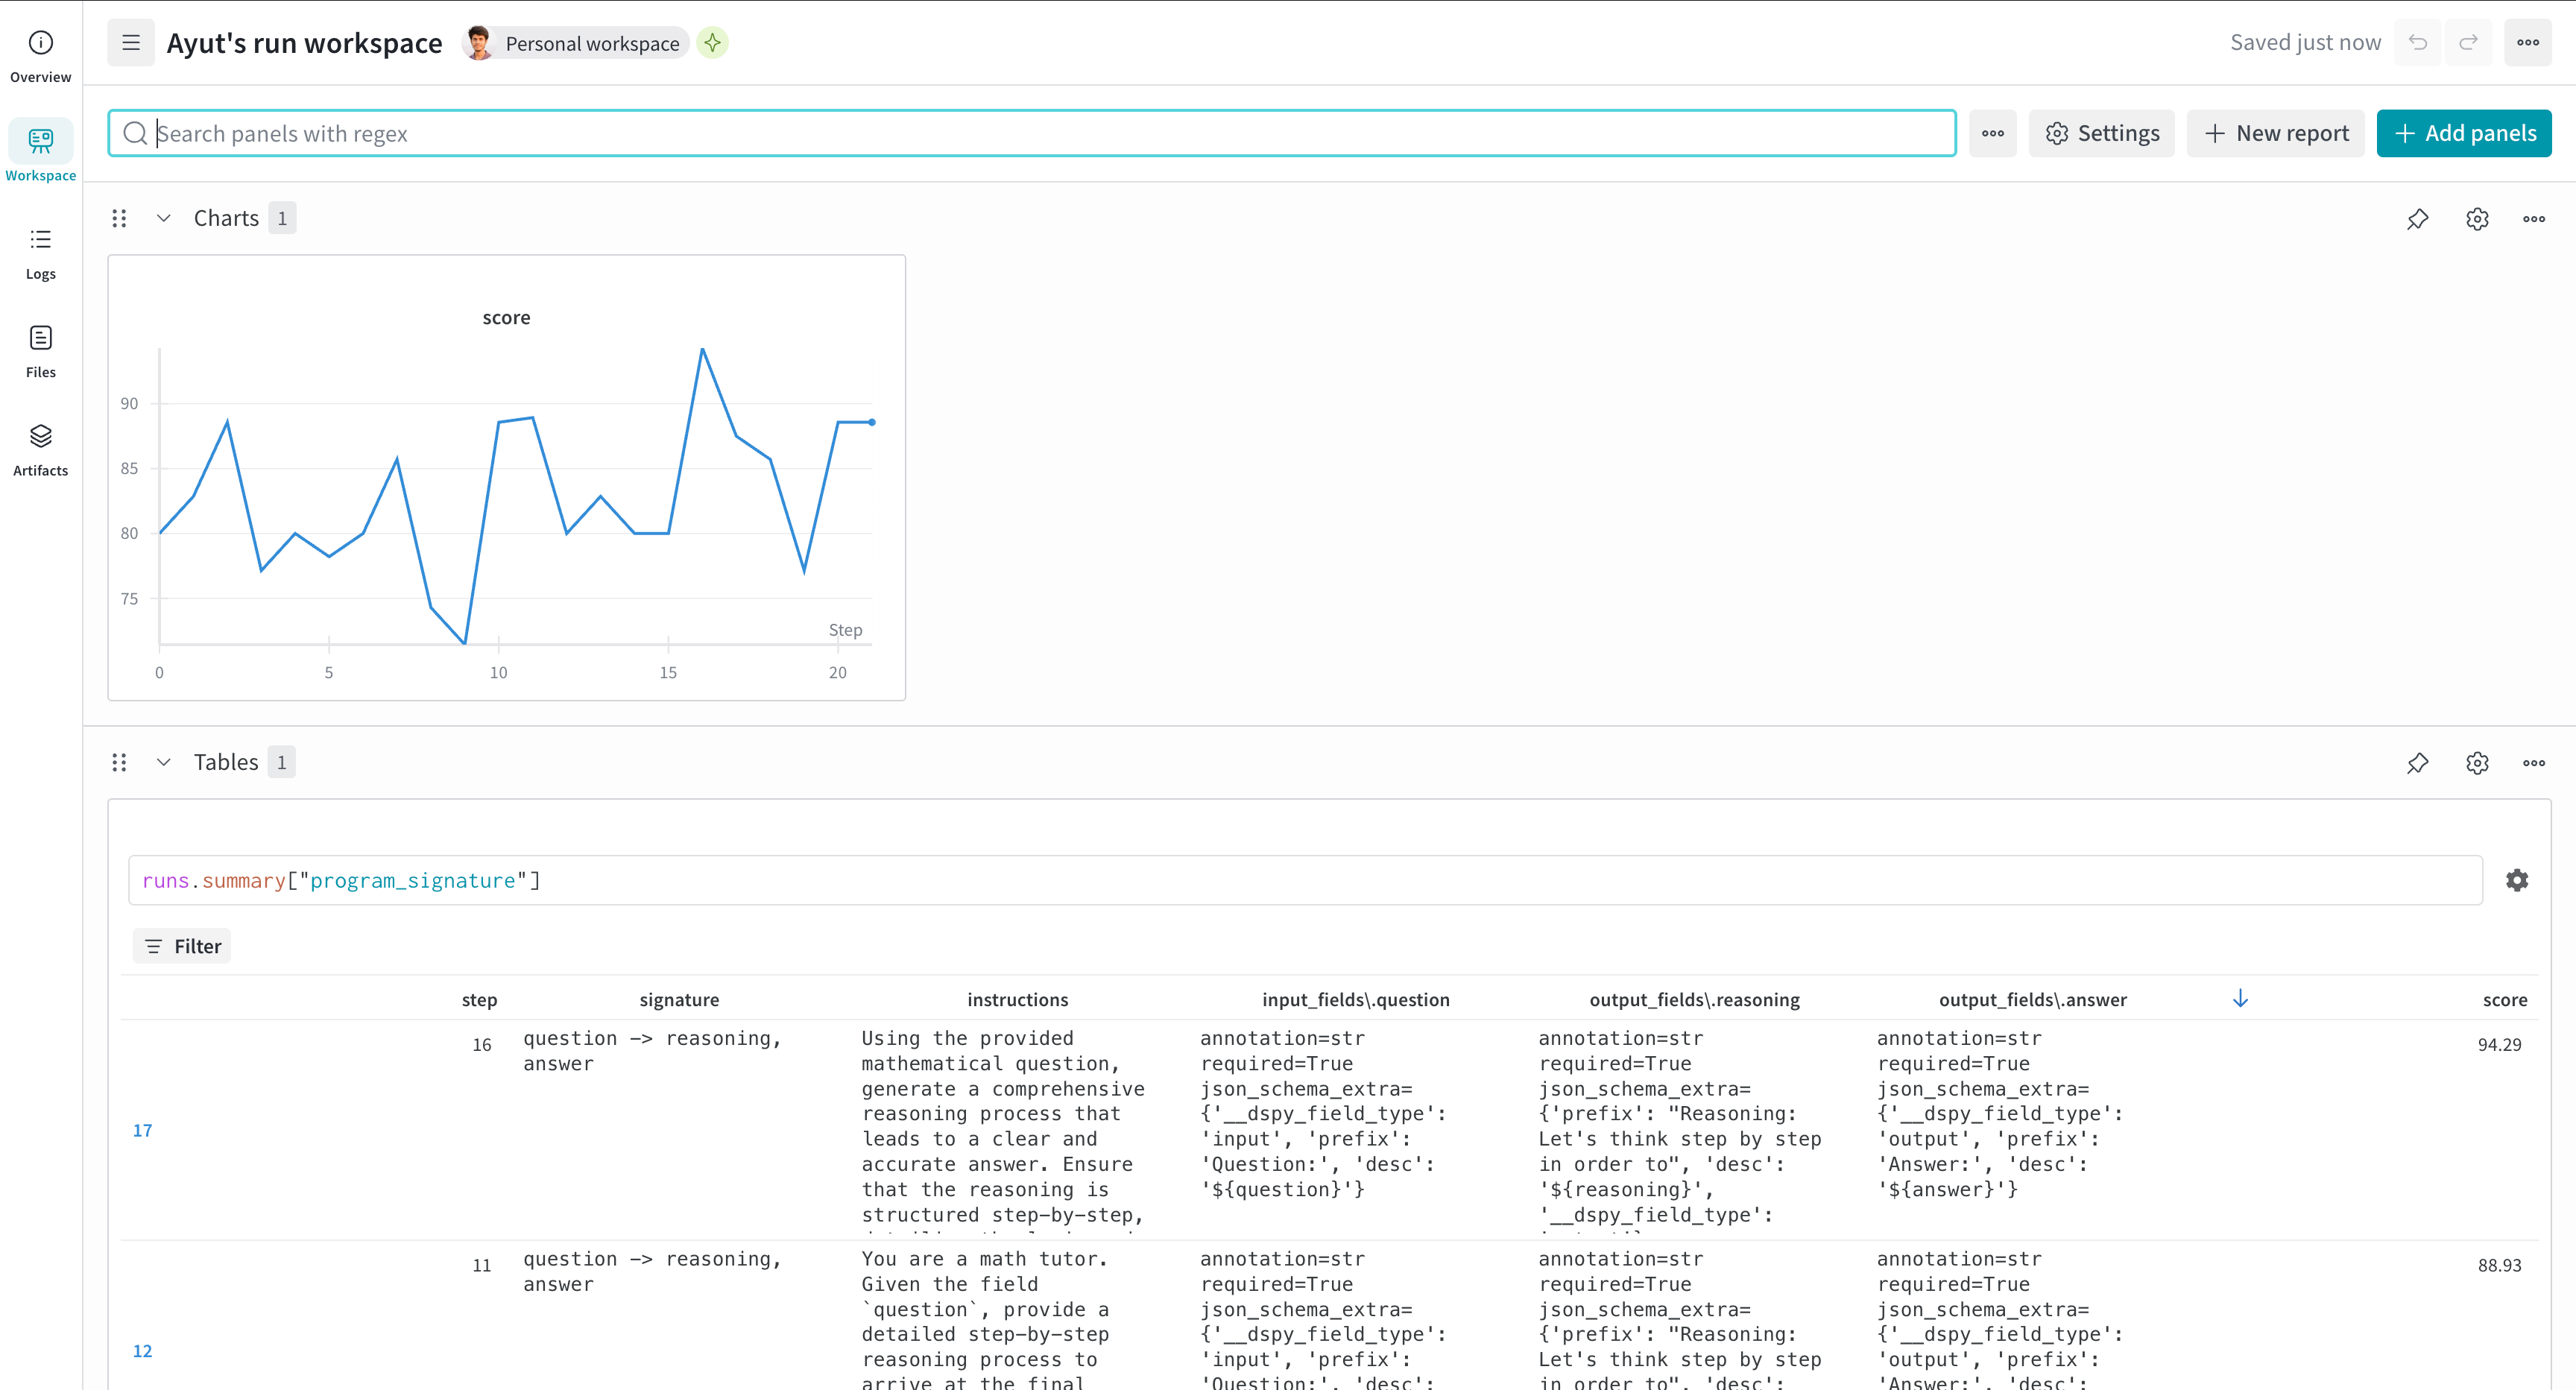
After running this code, you receive both a W&B Run URL and a Weave URL. W&B displays evaluation metrics over time, along with Tables that show the evolution of program signatures. The run’s Overview tab includes links to Weave traces for detailed inspection.
For comprehensive details about Weave tracing, evaluation, and optimization with DSPy, see the Weave DSPy integration guide.
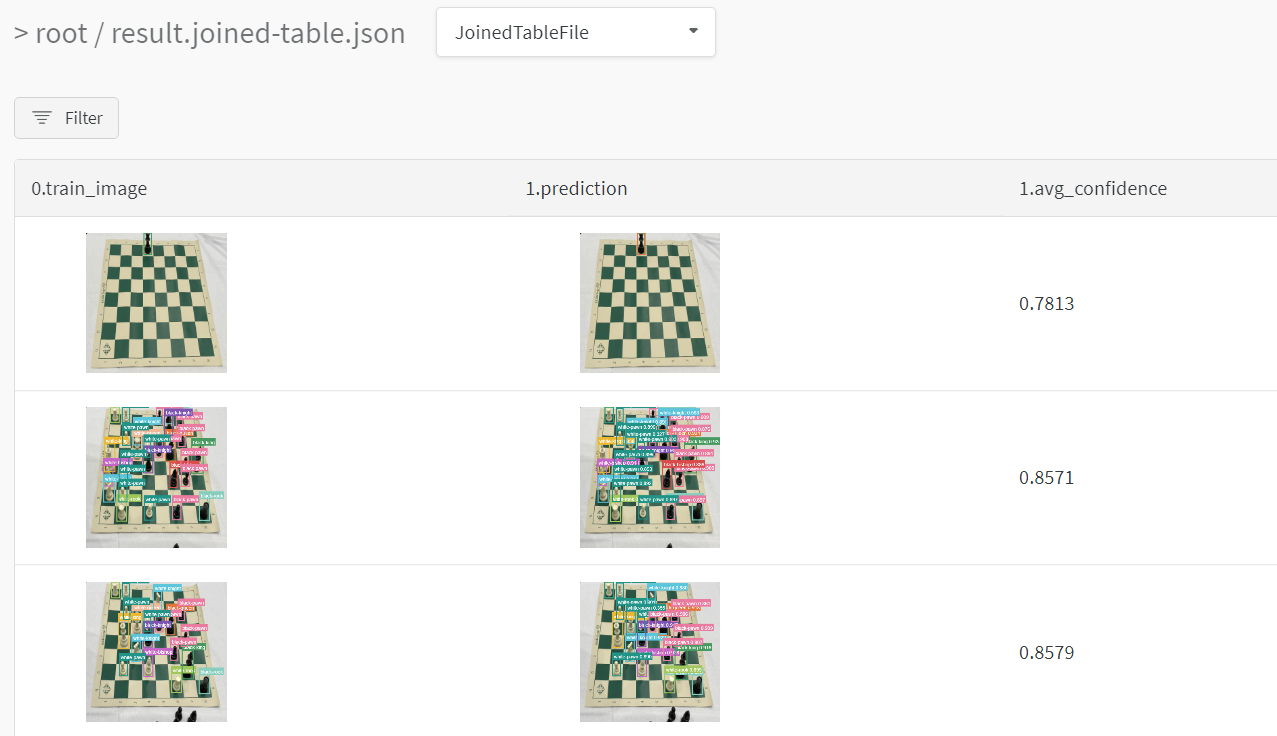
Log predictions to W&B Tables
Enable detailed prediction logging to inspect individual examples during optimization. The callback creates a W&B Tables for each evaluation step, which can help you to analyze specific successes and failures.
from wandb.integration.dspy import WandbDSPyCallback
# Enable prediction logging (enabled by default)callback = WandbDSPyCallback(log_results=True)
dspy.settings.callbacks.append(callback)
# Run your optimizationoptimized_program = optimizer.compile(program, trainset=train_data)
# Disable prediction logging if needed# callback = WandbDSPyCallback(log_results=False)
Access prediction data
After optimization, find your prediction data in W&B:
Navigate to your run’s Overview page.
Look for Table panels named with a pattern like predictions_0, predictions_1, and so forth.
Filter by is_correct to analyze failures.
Compare tables across runs in the project workspace.
The Hugging Face Transformers library makes state-of-the-art NLP models like BERT and training techniques like mixed precision and gradient checkpointing easy to use. The W&B integration adds rich, flexible experiment tracking and model versioning to interactive centralized dashboards without compromising that ease of use.
Next-level logging in few lines
os.environ["WANDB_PROJECT"] ="<my-amazing-project>"# name your W&B projectos.environ["WANDB_LOG_MODEL"] ="checkpoint"# log all model checkpointsfrom transformers import TrainingArguments, Trainer
args = TrainingArguments(..., report_to="wandb") # turn on W&B loggingtrainer = Trainer(..., args=args)
If you’d rather dive straight into working code, check out this Google Colab.
Get started: track experiments
Sign up and create an API key
An API key authenticates your machine to W&B. You can generate an API key from your user profile.
For a more streamlined approach, you can generate an API key by going directly to the W&B authorization page. Copy the displayed API key and save it in a secure location such as a password manager.
Click your user profile icon in the upper right corner.
Select User Settings, then scroll to the API Keys section.
Click Reveal. Copy the displayed API key. To hide the API key, reload the page.
If you are using W&B for the first time you might want to check out our quickstart
Name the project
A W&B Project is where all of the charts, data, and models logged from related runs are stored. Naming your project helps you organize your work and keep all the information about a single project in one place.
To add a run to a project simply set the WANDB_PROJECT environment variable to the name of your project. The WandbCallback will pick up this project name environment variable and use it when setting up your run.
WANDB_PROJECT=amazon_sentiment_analysis
import os
os.environ["WANDB_PROJECT"]="amazon_sentiment_analysis"
%env WANDB_PROJECT=amazon_sentiment_analysis
Make sure you set the project name before you initialize the Trainer.
If a project name is not specified the project name defaults to huggingface.
Log your training runs to W&B
This is the most important step when defining your Trainer training arguments, either inside your code or from the command line, is to set report_to to "wandb" in order enable logging with W&B.
The logging_steps argument in TrainingArguments will control how often training metrics are pushed to W&B during training. You can also give a name to the training run in W&B using the run_name argument.
That’s it. Now your models will log losses, evaluation metrics, model topology, and gradients to W&B while they train.
python run_glue.py \ # run your Python script --report_to wandb \ # enable logging to W&B --run_name bert-base-high-lr \ # name of the W&B run (optional)# other command line arguments here
from transformers import TrainingArguments, Trainer
args = TrainingArguments(
# other args and kwargs here report_to="wandb", # enable logging to W&B run_name="bert-base-high-lr", # name of the W&B run (optional) logging_steps=1, # how often to log to W&B)
trainer = Trainer(
# other args and kwargs here args=args, # your training args)
trainer.train() # start training and logging to W&B
Using TensorFlow? Just swap the PyTorch Trainer for the TensorFlow TFTrainer.
Turn on model checkpointing
Using Artifacts, you can store up to 100GB of models and datasets for free and then use the W&B Registry. Using Registry, you can register models to explore and evaluate them, prepare them for staging, or deploy them in your production environment.
To log your Hugging Face model checkpoints to Artifacts, set the WANDB_LOG_MODEL environment variable to one of:
checkpoint: Upload a checkpoint every args.save_steps from the TrainingArguments.
end: Upload the model at the end of training, if load_best_model_at_end is also set.
false: Do not upload the model.
WANDB_LOG_MODEL="checkpoint"
import os
os.environ["WANDB_LOG_MODEL"] ="checkpoint"
%env WANDB_LOG_MODEL="checkpoint"
Any Transformers Trainer you initialize from now on will upload models to your W&B project. The model checkpoints you log will be viewable through the Artifacts UI, and include the full model lineage (see an example model checkpoint in the UI here).
By default, your model will be saved to W&B Artifacts as model-{run_id} when WANDB_LOG_MODEL is set to end or checkpoint-{run_id} when WANDB_LOG_MODEL is set to checkpoint.
However, If you pass a run_name in your TrainingArguments, the model will be saved as model-{run_name} or checkpoint-{run_name}.
W&B Registry
Once you have logged your checkpoints to Artifacts, you can then register your best model checkpoints and centralize them across your team with Registry. Using Registry, you can organize your best models by task, manage the lifecycles of models, track and audit the entire ML lifecyle, and automate downstream actions.
Visualing your model outputs during training or evaluation is often essential to really understand how your model is training.
By using the callbacks system in the Transformers Trainer, you can log additional helpful data to W&B such as your models’ text generation outputs or other predictions to W&B Tables.
See the Custom logging section below for a full guide on how to log evaluation outputs while training to log to a W&B Table like this:
Finish your W&B Run (Notebook only)
If your training is encapsulated in a Python script, the W&B run will end when your script finishes.
If you are using a Jupyter or Google Colab notebook, you’ll need to tell us when you’re done with training by calling run.finish().
run = wandb.init()
trainer.train() # start training and logging to W&B# post-training analysis, testing, other logged coderun.finish()
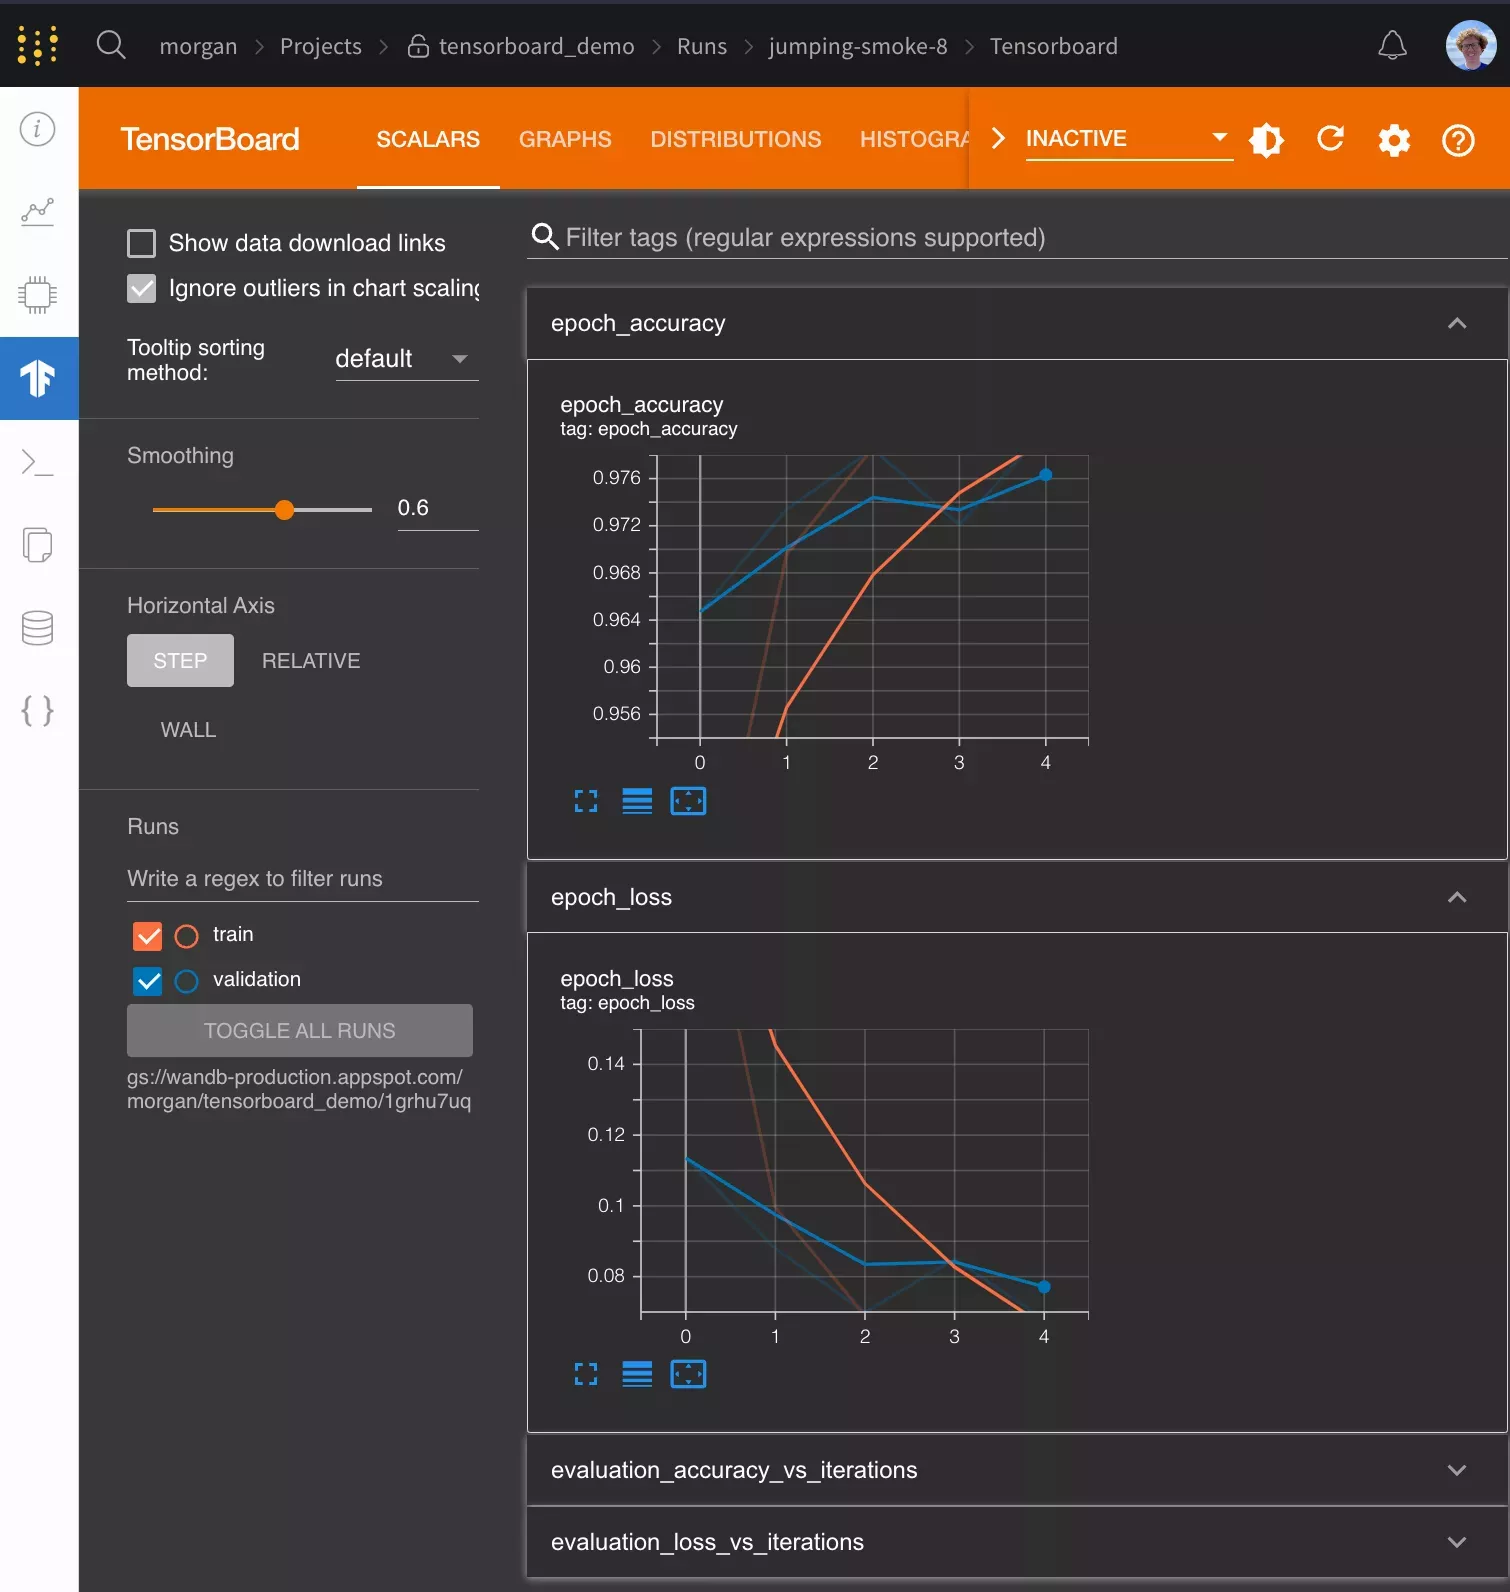
Visualize your results
Once you have logged your training results you can explore your results dynamically in the W&B Dashboard. It’s easy to compare across dozens of runs at once, zoom in on interesting findings, and coax insights out of complex data with flexible, interactive visualizations.
Advanced features and FAQs
How do I save the best model?
If you pass TrainingArguments with load_best_model_at_end=True to your Trainer, W&B saves the best performing model checkpoint to Artifacts.
If you save your model checkpoints as Artifacts, you can promote them to the Registry. In Registry, you can:
Organize your best model versions by ML task.
Centralize models and share them with your team.
Stage models for production or bookmark them for further evaluation.
Trigger downstream CI/CD processes.
How do I load a saved model?
If you saved your model to W&B Artifacts with WANDB_LOG_MODEL, you can download your model weights for additional training or to run inference. You just load them back into the same Hugging Face architecture that you used before.
# Create a new runwith wandb.init(project="amazon_sentiment_analysis") as run:
# Pass the name and version of Artifact my_model_name ="model-bert-base-high-lr:latest" my_model_artifact = run.use_artifact(my_model_name)
# Download model weights to a folder and return the path model_dir = my_model_artifact.download()
# Load your Hugging Face model from that folder# using the same model class model = AutoModelForSequenceClassification.from_pretrained(
model_dir, num_labels=num_labels
)
# Do additional training, or run inference
How do I resume training from a checkpoint?
If you had set WANDB_LOG_MODEL='checkpoint' you can also resume training by you can using the model_dir as the model_name_or_path argument in your TrainingArguments and pass resume_from_checkpoint=True to Trainer.
last_run_id ="xxxxxxxx"# fetch the run_id from your wandb workspace# resume the wandb run from the run_idwith wandb.init(
project=os.environ["WANDB_PROJECT"],
id=last_run_id,
resume="must",
) as run:
# Connect an Artifact to the run my_checkpoint_name =f"checkpoint-{last_run_id}:latest" my_checkpoint_artifact = run.use_artifact(my_model_name)
# Download checkpoint to a folder and return the path checkpoint_dir = my_checkpoint_artifact.download()
# reinitialize your model and trainer model = AutoModelForSequenceClassification.from_pretrained(
"<model_name>", num_labels=num_labels
)
# your awesome training arguments here. training_args = TrainingArguments()
trainer = Trainer(model=model, args=training_args)
# make sure use the checkpoint dir to resume training from the checkpoint trainer.train(resume_from_checkpoint=checkpoint_dir)
How do I log and view evaluation samples during training
Logging to W&B via the Transformers Trainer is taken care of by the WandbCallback in the Transformers library. If you need to customize your Hugging Face logging you can modify this callback by subclassing WandbCallback and adding additional functionality that leverages additional methods from the Trainer class.
Below is the general pattern to add this new callback to the HF Trainer, and further down is a code-complete example to log evaluation outputs to a W&B Table:
# Instantiate the Trainer as normaltrainer = Trainer()
# Instantiate the new logging callback, passing it the Trainer objectevals_callback = WandbEvalsCallback(trainer, tokenizer, ...)
# Add the callback to the Trainertrainer.add_callback(evals_callback)
# Begin Trainer training as normaltrainer.train()
View evaluation samples during training
The following section shows how to customize the WandbCallback to run model predictions and log evaluation samples to a W&B Table during training. We will every eval_steps using the on_evaluate method of the Trainer callback.
Here, we wrote a decode_predictions function to decode the predictions and labels from the model output using the tokenizer.
Then, we create a pandas DataFrame from the predictions and labels and add an epoch column to the DataFrame.
Finally, we create a wandb.Table from the DataFrame and log it to wandb.
Additionally, we can control the frequency of logging by logging the predictions every freq epochs.
Note: Unlike the regular WandbCallback this custom callback needs to be added to the trainer after the Trainer is instantiated and not during initialization of the Trainer.
This is because the Trainer instance is passed to the callback during initialization.
from transformers.integrations import WandbCallback
import pandas as pd
defdecode_predictions(tokenizer, predictions):
labels = tokenizer.batch_decode(predictions.label_ids)
logits = predictions.predictions.argmax(axis=-1)
prediction_text = tokenizer.batch_decode(logits)
return {"labels": labels, "predictions": prediction_text}
classWandbPredictionProgressCallback(WandbCallback):
"""Custom WandbCallback to log model predictions during training.
This callback logs model predictions and labels to a wandb.Table at each
logging step during training. It allows to visualize the
model predictions as the training progresses.
Attributes:
trainer (Trainer): The Hugging Face Trainer instance.
tokenizer (AutoTokenizer): The tokenizer associated with the model.
sample_dataset (Dataset): A subset of the validation dataset
for generating predictions.
num_samples (int, optional): Number of samples to select from
the validation dataset for generating predictions. Defaults to 100.
freq (int, optional): Frequency of logging. Defaults to 2.
"""def__init__(self, trainer, tokenizer, val_dataset, num_samples=100, freq=2):
"""Initializes the WandbPredictionProgressCallback instance.
Args:
trainer (Trainer): The Hugging Face Trainer instance.
tokenizer (AutoTokenizer): The tokenizer associated
with the model.
val_dataset (Dataset): The validation dataset.
num_samples (int, optional): Number of samples to select from
the validation dataset for generating predictions.
Defaults to 100.
freq (int, optional): Frequency of logging. Defaults to 2.
""" super().__init__()
self.trainer = trainer
self.tokenizer = tokenizer
self.sample_dataset = val_dataset.select(range(num_samples))
self.freq = freq
defon_evaluate(self, args, state, control, **kwargs):
super().on_evaluate(args, state, control, **kwargs)
# control the frequency of logging by logging the predictions# every `freq` epochsif state.epoch % self.freq ==0:
# generate predictions predictions = self.trainer.predict(self.sample_dataset)
# decode predictions and labels predictions = decode_predictions(self.tokenizer, predictions)
# add predictions to a wandb.Table predictions_df = pd.DataFrame(predictions)
predictions_df["epoch"] = state.epoch
records_table = self._wandb.Table(dataframe=predictions_df)
# log the table to wandb self._wandb.log({"sample_predictions": records_table})
# First, instantiate the Trainertrainer = Trainer(
model=model,
args=training_args,
train_dataset=lm_datasets["train"],
eval_dataset=lm_datasets["validation"],
)
# Instantiate the WandbPredictionProgressCallbackprogress_callback = WandbPredictionProgressCallback(
trainer=trainer,
tokenizer=tokenizer,
val_dataset=lm_dataset["validation"],
num_samples=10,
freq=2,
)
# Add the callback to the trainertrainer.add_callback(progress_callback)
For a more detailed example please refer to this colab
What additional W&B settings are available?
Further configuration of what is logged with Trainer is possible by setting environment variables. A full list of W&B environment variables can be found here.
Environment Variable
Usage
WANDB_PROJECT
Give your project a name (huggingface by default)
WANDB_LOG_MODEL
Log the model checkpoint as a W&B Artifact (false by default)
false (default): No model checkpointing
checkpoint: A checkpoint will be uploaded every args.save_steps (set in the Trainer’s TrainingArguments).
end: The final model checkpoint will be uploaded at the end of training.
WANDB_WATCH
Set whether you’d like to log your models gradients, parameters or neither
false (default): No gradient or parameter logging
gradients: Log histograms of the gradients
all: Log histograms of gradients and parameters
WANDB_DISABLED
Set to true to turn off logging entirely (false by default)
WANDB_QUIET.
Set to true to limit statements logged to standard output to critical statements only (false by default)
WANDB_SILENT
Set to true to silence the output printed by wandb (false by default)
WANDB_WATCH=all
WANDB_SILENT=true
%env WANDB_WATCH=all
%env WANDB_SILENT=true
How do I customize wandb.init?
The WandbCallback that Trainer uses will call wandb.init under the hood when Trainer is initialized. You can alternatively set up your runs manually by calling wandb.init before theTrainer is initialized. This gives you full control over your W&B run configuration.
An example of what you might want to pass to init is below. For wandb.init() details, see the wandb.init() reference.
Below are 6 Transformers and W&B related articles you might enjoy
Hyperparameter Optimization for Hugging Face Transformers
Three strategies for hyperparameter optimization for Hugging Face Transformers are compared: Grid Search, Bayesian Optimization, and Population Based Training.
We use a standard uncased BERT model from Hugging Face transformers, and we want to fine-tune on the RTE dataset from the SuperGLUE benchmark
Results show that Population Based Training is the most effective approach to hyperparameter optimization of our Hugging Face transformer model.
In the article, the author demonstrates how to fine-tune a pre-trained GPT2 HuggingFace Transformer model on anyone’s Tweets in five minutes.
The model uses the following pipeline: Downloading Tweets, Optimizing the Dataset, Initial Experiments, Comparing Losses Between Users, Fine-Tuning the Model.
Sentence Classification With Hugging Face BERT and WB
In this article, we’ll build a sentence classifier leveraging the power of recent breakthroughs in Natural Language Processing, focusing on an application of transfer learning to NLP.
We’ll be using The Corpus of Linguistic Acceptability (CoLA) dataset for single sentence classification, which is a set of sentences labeled as grammatically correct or incorrect that was first published in May 2018.
We’ll use Google’s BERT to create high performance models with minimal effort on a range of NLP tasks.
A Step by Step Guide to Tracking Hugging Face Model Performance
We use W&B and Hugging Face transformers to train DistilBERT, a Transformer that’s 40% smaller than BERT but retains 97% of BERT’s accuracy, on the GLUE benchmark
The GLUE benchmark is a collection of nine datasets and tasks for training NLP models
WandbMetricsLogger automatically logs Keras’ logs dictionary that callback methods such as on_epoch_end, on_batch_end etc, take as an argument.
This tracks:
Training and validation metrics defined in model.compile.
System (CPU/GPU/TPU) metrics.
Learning rate (both for a fixed value or a learning rate scheduler.
import wandb
from wandb.integration.keras import WandbMetricsLogger
# Initialize a new W&B Runwandb.init(config={"bs": 12})
# Pass the WandbMetricsLogger to model.fitmodel.fit(
X_train, y_train, validation_data=(X_test, y_test), callbacks=[WandbMetricsLogger()]
)
WandbMetricsLogger reference
Parameter
Description
log_freq
(epoch, batch, or an int): if epoch, logs metrics at the end of each epoch. If batch, logs metrics at the end of each batch. If an int, logs metrics at the end of that many batches. Defaults to epoch.
initial_global_step
(int): Use this argument to correctly log the learning rate when you resume training from some initial_epoch, and a learning rate scheduler is used. This can be computed as step_size * initial_step. Defaults to 0.
Use WandbModelCheckpoint callback to save the Keras model (SavedModel format) or model weights periodically and uploads them to W&B as a wandb.Artifact for model versioning.
This callback is subclassed from tf.keras.callbacks.ModelCheckpoint ,thus the checkpointing logic is taken care of by the parent callback.
This callback saves:
The model that has achieved best performance based on the monitor.
The model at the end of every epoch regardless of the performance.
The model at the end of the epoch or after a fixed number of training batches.
Only model weights or the whole model.
The model either in SavedModel format or in .h5 format.
Use this callback in conjunction with WandbMetricsLogger.
import wandb
from wandb.integration.keras import WandbMetricsLogger, WandbModelCheckpoint
# Initialize a new W&B Runwandb.init(config={"bs": 12})
# Pass the WandbModelCheckpoint to model.fitmodel.fit(
X_train,
y_train,
validation_data=(X_test, y_test),
callbacks=[
WandbMetricsLogger(),
WandbModelCheckpoint("models"),
],
)
WandbModelCheckpoint reference
Parameter
Description
filepath
(str): path to save the mode file.
monitor
(str): The metric name to monitor.
verbose
(int): Verbosity mode, 0 or 1. Mode 0 is silent, and mode 1 displays messages when the callback takes an action.
save_best_only
(Boolean): if save_best_only=True, it only saves the latest model or the model it considers the best, according to the defined by the monitor and mode attributes.
save_weights_only
(Boolean): if True, saves only the model’s weights.
mode
(auto, min, or max): For val_acc, set it to max, for val_loss, set it to min, and so on
save_freq
(“epoch” or int): When using ‘epoch’, the callback saves the model after each epoch. When using an integer, the callback saves the model at end of this many batches. Note that when monitoring validation metrics such as val_acc or val_loss, save_freq must be set to “epoch” as those metrics are only available at the end of an epoch.
options
(str): Optional tf.train.CheckpointOptions object if save_weights_only is true or optional tf.saved_model.SaveOptions object if save_weights_only is false.
initial_value_threshold
(float): Floating point initial “best” value of the metric to be monitored.
Log checkpoints after N epochs
By default (save_freq="epoch"), the callback creates a checkpoint and uploads it as an artifact after each epoch. To create a checkpoint after a specific number of batches, set save_freq to an integer. To checkpoint after N epochs, compute the cardinality of the train dataloader and pass it to save_freq:
While checkpointing on TPUs you might encounter UnimplementedError: File system scheme '[local]' not implemented error message. This happens because the model directory (filepath) must use a cloud storage bucket path (gs://bucket-name/...), and this bucket must be accessible from the TPU server. We can however, use the local path for checkpointing which in turn is uploaded as an Artifacts.
The WandbEvalCallback is an abstract base class to build Keras callbacks primarily for model prediction and, secondarily, dataset visualization.
This abstract callback is agnostic with respect to the dataset and the task. To use this, inherit from this base WandbEvalCallback callback class and implement the add_ground_truth and add_model_prediction methods.
The WandbEvalCallback is a utility class that provides methods to:
Create data and prediction wandb.Table instances.
Log data and prediction Tables as wandb.Artifact.
Log the data table on_train_begin.
log the prediction table on_epoch_end.
The following example uses WandbClfEvalCallback for an image classification task. This example callback logs the validation data (data_table) to W&B, performs inference, and logs the prediction (pred_table) to W&B at the end of every epoch.
import wandb
from wandb.integration.keras import WandbMetricsLogger, WandbEvalCallback
# Implement your model prediction visualization callbackclassWandbClfEvalCallback(WandbEvalCallback):
def__init__(
self, validation_data, data_table_columns, pred_table_columns, num_samples=100 ):
super().__init__(data_table_columns, pred_table_columns)
self.x = validation_data[0]
self.y = validation_data[1]
defadd_ground_truth(self, logs=None):
for idx, (image, label) in enumerate(zip(self.x, self.y)):
self.data_table.add_data(idx, wandb.Image(image), label)
defadd_model_predictions(self, epoch, logs=None):
preds = self.model.predict(self.x, verbose=0)
preds = tf.argmax(preds, axis=-1)
table_idxs = self.data_table_ref.get_index()
for idx in table_idxs:
pred = preds[idx]
self.pred_table.add_data(
epoch,
self.data_table_ref.data[idx][0],
self.data_table_ref.data[idx][1],
self.data_table_ref.data[idx][2],
pred,
)
# ...# Initialize a new W&B Runwandb.init(config={"hyper": "parameter"})
# Add the Callbacks to Model.fitmodel.fit(
X_train,
y_train,
validation_data=(X_test, y_test),
callbacks=[
WandbMetricsLogger(),
WandbClfEvalCallback(
validation_data=(X_test, y_test),
data_table_columns=["idx", "image", "label"],
pred_table_columns=["epoch", "idx", "image", "label", "pred"],
),
],
)
The W&B Artifact page includes Table logs by default, rather than the Workspace page.
WandbEvalCallback reference
Parameter
Description
data_table_columns
(list) List of column names for the data_table
pred_table_columns
(list) List of column names for the pred_table
Memory footprint details
We log the data_table to W&B when the on_train_begin method is invoked. Once it’s uploaded as a W&B Artifact, we get a reference to this table which can be accessed using data_table_ref class variable. The data_table_ref is a 2D list that can be indexed like self.data_table_ref[idx][n], where idx is the row number while n is the column number. Let’s see the usage in the example below.
Customize the callback
You can override the on_train_begin or on_epoch_end methods to have more fine-grained control. If you want to log the samples after N batches, you can implement on_train_batch_end method.
If you are implementing a callback for model prediction visualization by inheriting WandbEvalCallback and something needs to be clarified or fixed, let us know by opening an issue.
WandbCallback [legacy]
Use the W&B library WandbCallback Class to automatically save all the metrics and the loss values tracked in model.fit.
import wandb
from wandb.integration.keras import WandbCallback
wandb.init(config={"hyper": "parameter"})
...# code to set up your model in Keras# Pass the callback to model.fitmodel.fit(
X_train, y_train, validation_data=(X_test, y_test), callbacks=[WandbCallback()]
)
The WandbCallback class supports a wide variety of logging configuration options: specifying a metric to monitor, tracking of weights and gradients, logging of predictions on training_data and validation_data, and more.
Check out the reference documentation for the keras.WandbCallback for full details.
The WandbCallback
Automatically logs history data from any metrics collected by Keras: loss and anything passed into keras_model.compile().
Sets summary metrics for the run associated with the “best” training step, as defined by the monitor and mode attributes. This defaults to the epoch with the minimum val_loss. WandbCallback by default saves the model associated with the best epoch.
Optionally logs gradient and parameter histogram.
Optionally saves training and validation data for wandb to visualize.
WandbCallback reference
Arguments
monitor
(str) name of metric to monitor. Defaults to val_loss.
mode
(str) one of {auto, min, max}. min - save model when monitor is minimized max - save model when monitor is maximized auto - try to guess when to save the model (default).
save_model
True - save a model when monitor beats all previous epochs False - don’t save models
save_graph
(boolean) if True save model graph to wandb (default to True).
save_weights_only
(boolean) if True, saves only the model’s weights(model.save_weights(filepath)). Otherwise, saves the full model).
log_weights
(boolean) if True save histograms of the model’s layer’s weights.
log_gradients
(boolean) if True log histograms of the training gradients
training_data
(tuple) Same format (X,y) as passed to model.fit. This is needed for calculating gradients - this is mandatory if log_gradients is True.
validation_data
(tuple) Same format (X,y) as passed to model.fit. A set of data for wandb to visualize. If you set this field, every epoch, wandb makes a small number of predictions and saves the results for later visualization.
generator
(generator) a generator that returns validation data for wandb to visualize. This generator should return tuples (X,y). Either validate_data or generator should be set for wandb to visualize specific data examples.
validation_steps
(int) if validation_data is a generator, how many steps to run the generator for the full validation set.
labels
(list) If you are visualizing your data with wandb this list of labels converts numeric output to understandable string if you are building a classifier with multiple classes. For a binary classifier, you can pass in a list of two labels [label for false, label for true]. If validate_data and generator are both false, this does nothing.
predictions
(int) the number of predictions to make for visualization each epoch, max is 100.
input_type
(string) type of the model input to help visualization. can be one of: (image, images, segmentation_mask).
output_type
(string) type of the model output to help visualziation. can be one of: (image, images, segmentation_mask).
log_evaluation
(boolean) if True, save a Table containing validation data and the model’s predictions at each epoch. See validation_indexes, validation_row_processor, and output_row_processor for additional details.
class_colors
([float, float, float]) if the input or output is a segmentation mask, an array containing an rgb tuple (range 0-1) for each class.
log_batch_frequency
(integer) if None, callback logs every epoch. If set to integer, callback logs training metrics every log_batch_frequency batches.
log_best_prefix
(string) if None, saves no extra summary metrics. If set to a string, prepends the monitored metric and epoch with the prefix and saves the results as summary metrics.
validation_indexes
([wandb.data_types._TableLinkMixin]) an ordered list of index keys to associate with each validation example. If log_evaluation is True and you provide validation_indexes, does not create a Table of validation data. Instead, associates each prediction with the row represented by the TableLinkMixin. To obtain a list of row keys, use Table.get_index() .
validation_row_processor
(Callable) a function to apply to the validation data, commonly used to visualize the data. The function receives an ndx (int) and a row (dict). If your model has a single input, then row["input"] contains the input data for the row. Otherwise, it contains the names of the input slots. If your fit function takes a single target, then row["target"] contains the target data for the row. Otherwise, it contains the names of the output slots. For example, if your input data is a single array, to visualize the data as an Image, provide lambda ndx, row: {"img": wandb.Image(row["input"])} as the processor. Ignored if log_evaluation is False or validation_indexes are present.
output_row_processor
(Callable) same as validation_row_processor, but applied to the model’s output. row["output"] contains the results of the model output.
infer_missing_processors
(Boolean) Determines whether to infer validation_row_processor and output_row_processor if they are missing. Defaults to True. If you provide labels, W&B attempts to infer classification-type processors where appropriate.
log_evaluation_frequency
(int) Determines how often to log evaluation results. Defaults to 0 to log only at the end of training. Set to 1 to log every epoch, 2 to log every other epoch, and so on. Has no effect when log_evaluation is False.
Frequently Asked Questions
How do I use Keras multiprocessing with wandb?
When setting use_multiprocessing=True, this error may occur:
Error("You must call wandb.init() before wandb.config.batch_size")
To work around it:
In the Sequence class construction, add: wandb.init(group='...').
In main, make sure you’re using if __name__ == "__main__": and put the rest of your script logic inside it.
The wandb library includes a special callback for LightGBM. It’s also easy to use the generic logging features of W&B to track large experiments, like hyperparameter sweeps.
from wandb.integration.lightgbm import wandb_callback, log_summary
import lightgbm as lgb
# Log metrics to W&Bgbm = lgb.train(..., callbacks=[wandb_callback()])
# Log feature importance plot and upload model checkpoint to W&Blog_summary(gbm, save_model_checkpoint=True)
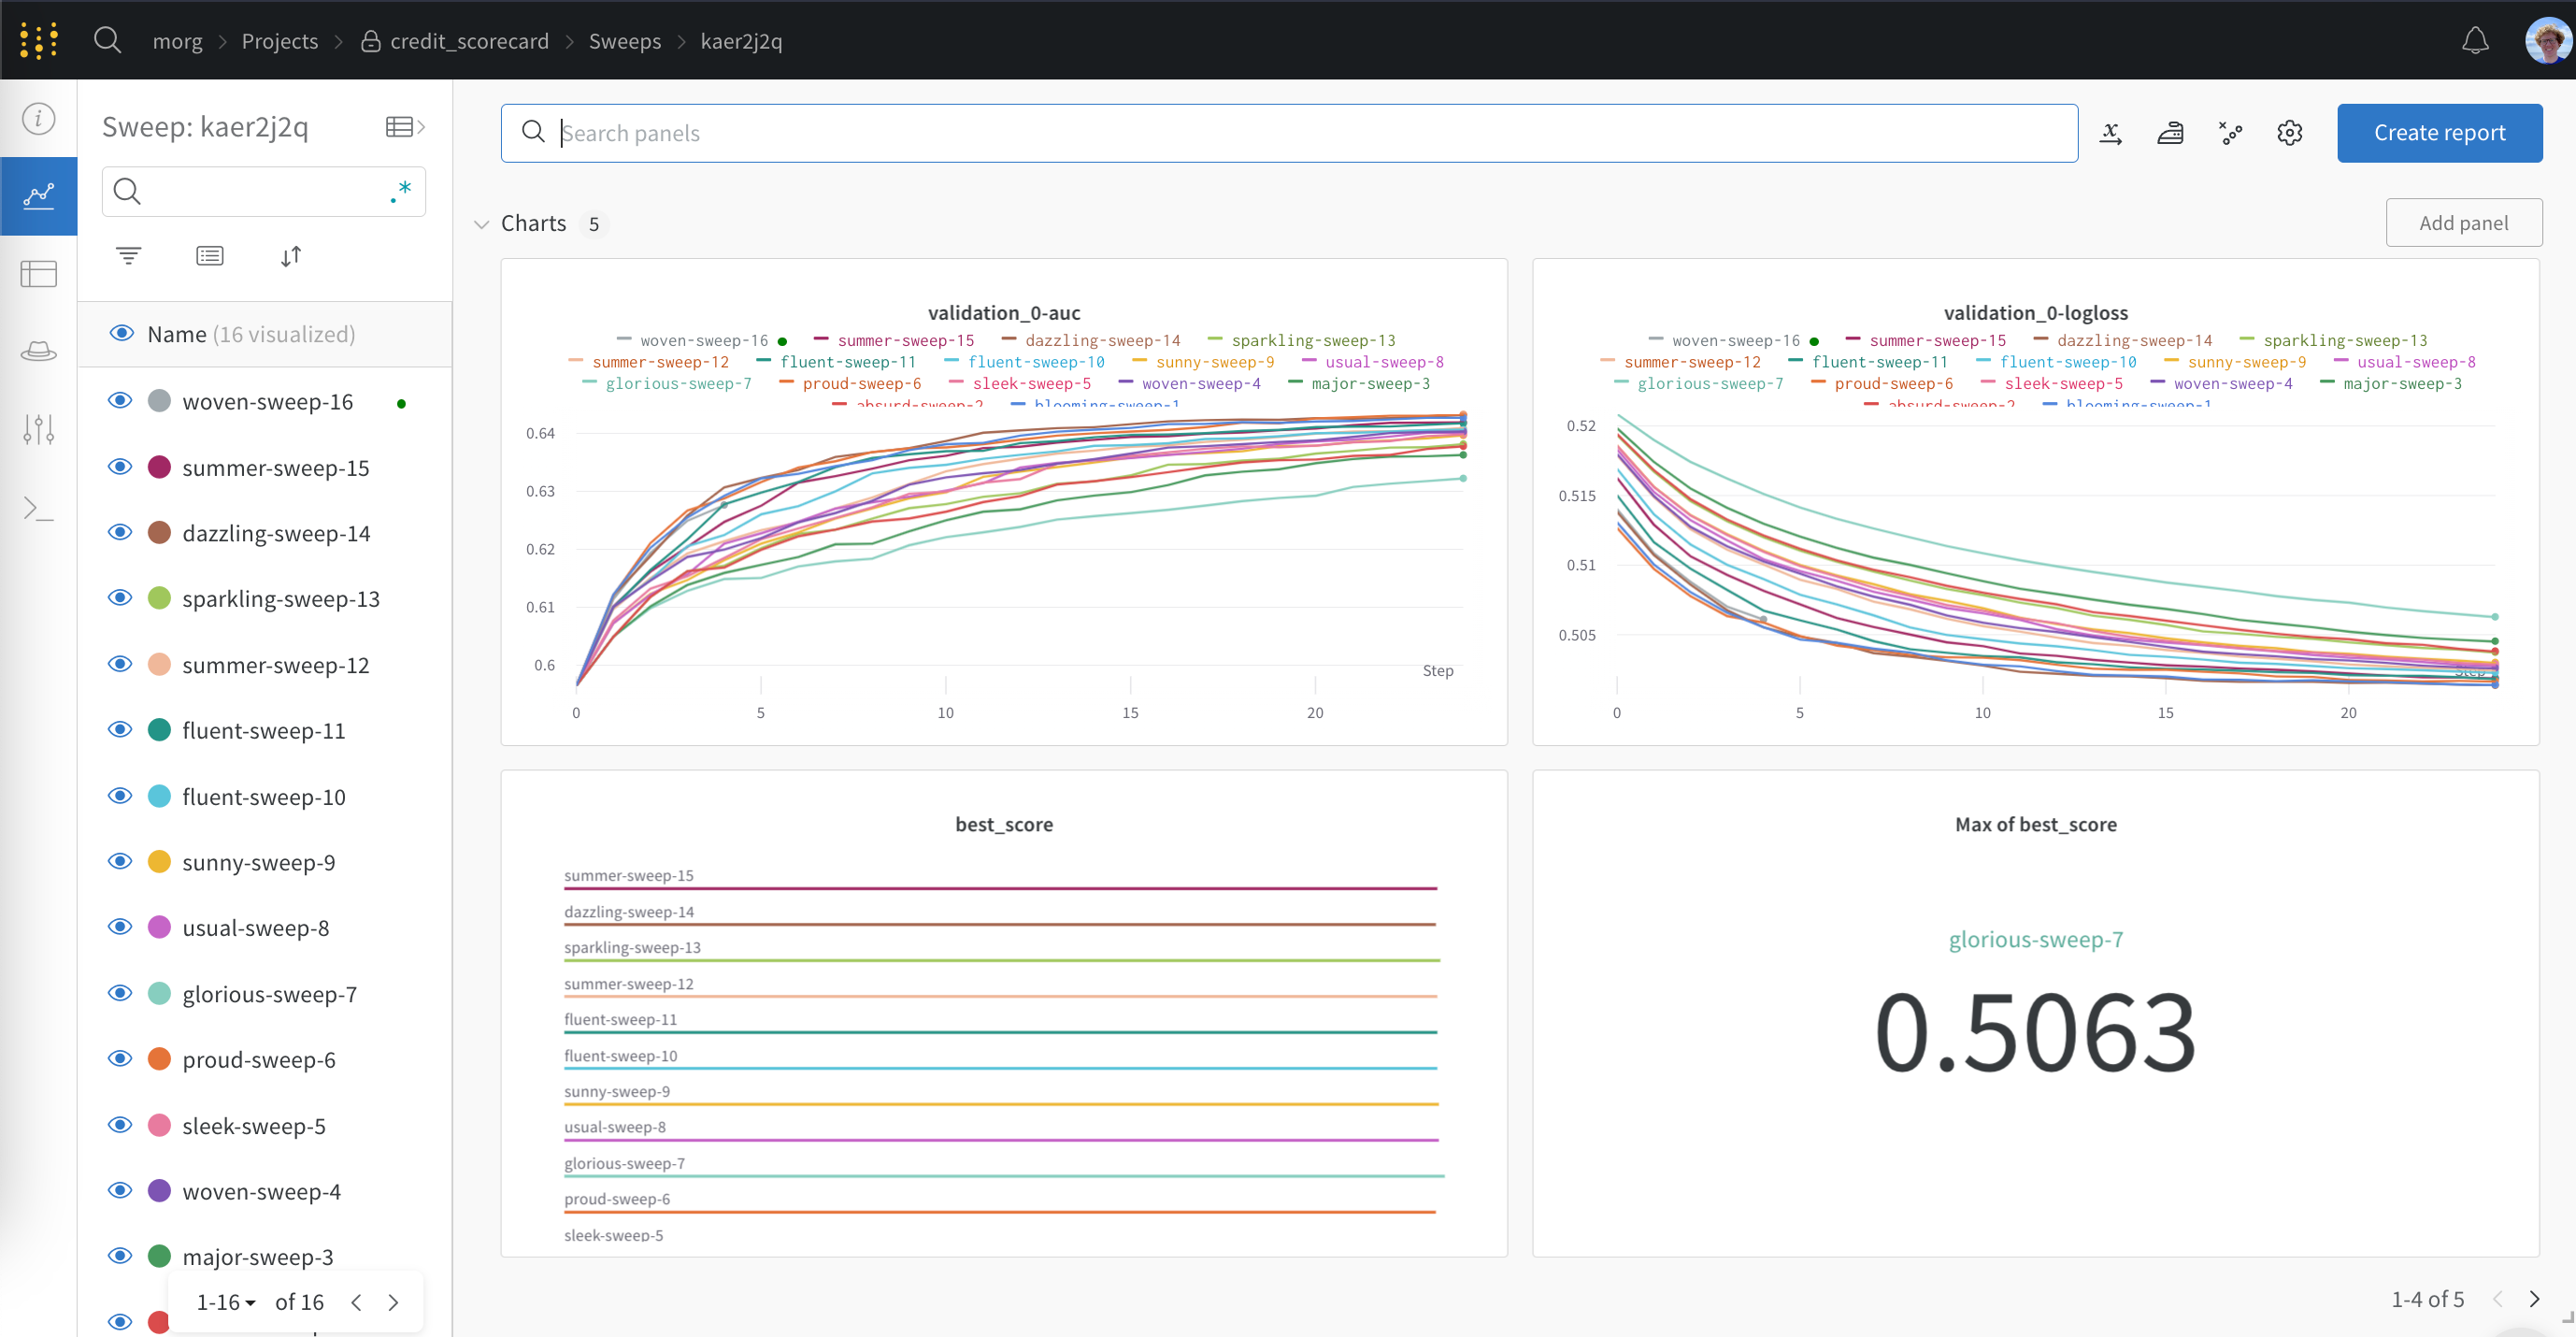
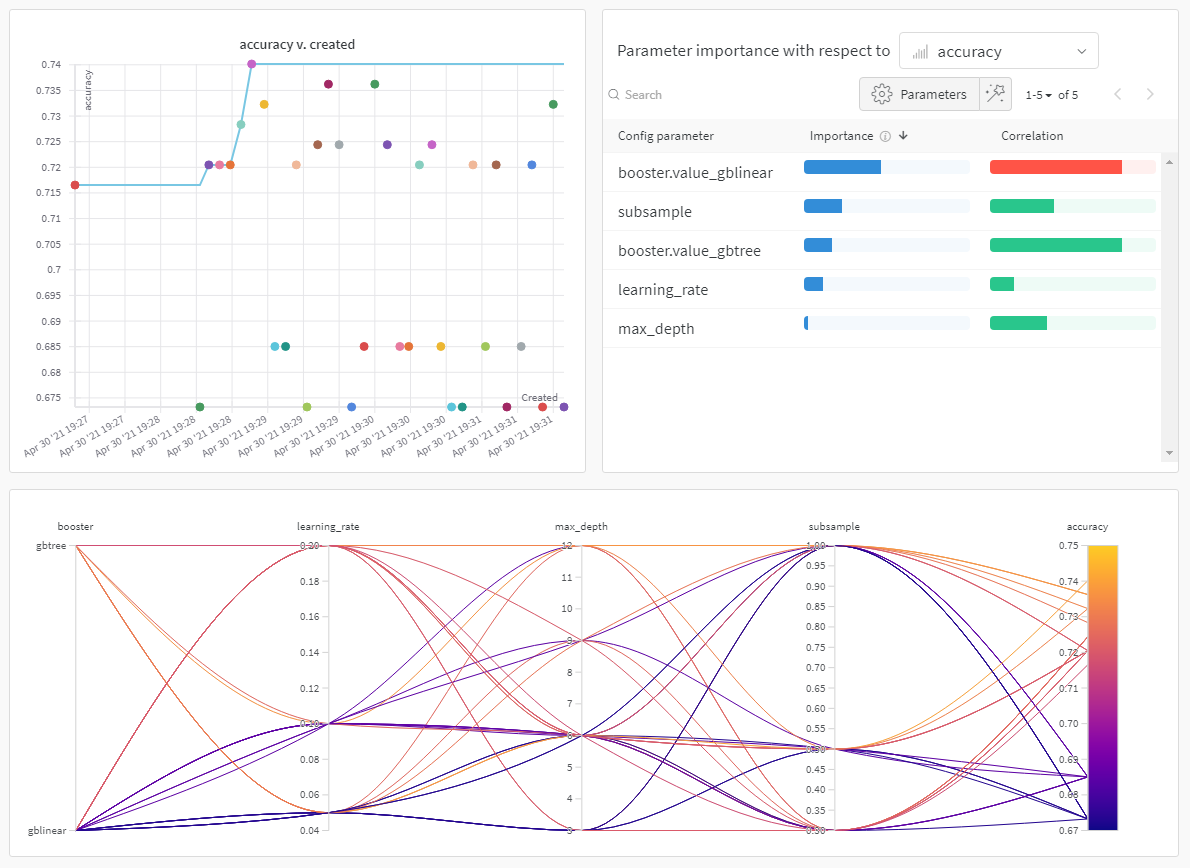
Attaining the maximum performance out of models requires tuning hyperparameters, like tree depth and learning rate. W&B Sweeps is a powerful toolkit for configuring, orchestrating, and analyzing large hyperparameter testing experiments.
To learn more about these tools and see an example of how to use Sweeps with XGBoost, check out this interactive Colab notebook.
Use the W&B OpenAI API integration to log requests, responses, token counts and model metadata for all OpenAI models, including fine-tuned models.
See the OpenAI fine-tuning integration to learn how to use W&B to track your fine-tuning experiments, models, and datasets and share your results with your colleagues.
Log your API inputs and outputs you can quickly evaluate the performance of difference prompts, compare different model settings (such as temperature), and track other usage metrics such as token usage.
Install OpenAI Python API library
The W&B autolog integration works with OpenAI version 0.28.1 and below.
To install OpenAI Python API version 0.28.1, run:
pip install openai==0.28.1
Use the OpenAI Python API
1. Import autolog and initialise it
First, import autolog from wandb.integration.openai and initialise it.
import os
import openai
from wandb.integration.openai import autolog

autolog({"project": "gpt5"})
You can optionally pass a dictionary with argument that wandb.init() accepts to autolog. This includes a project name, team name, entity, and more. For more information about wandb.init(), see the API Reference Guide.
2. Call the OpenAI API
Each call you make to the OpenAI API is now logged to W&B automatically.
os.environ["OPENAI_API_KEY"] ="XXX"chat_request_kwargs = dict(
model="gpt-3.5-turbo",
messages=[
{"role": "system", "content": "You are a helpful assistant."},
{"role": "user", "content": "Who won the world series in 2020?"},
{"role": "assistant", "content": "The Los Angeles Dodgers"},
{"role": "user", "content": "Where was it played?"},
],
)
response = openai.ChatCompletion.create(**chat_request_kwargs)
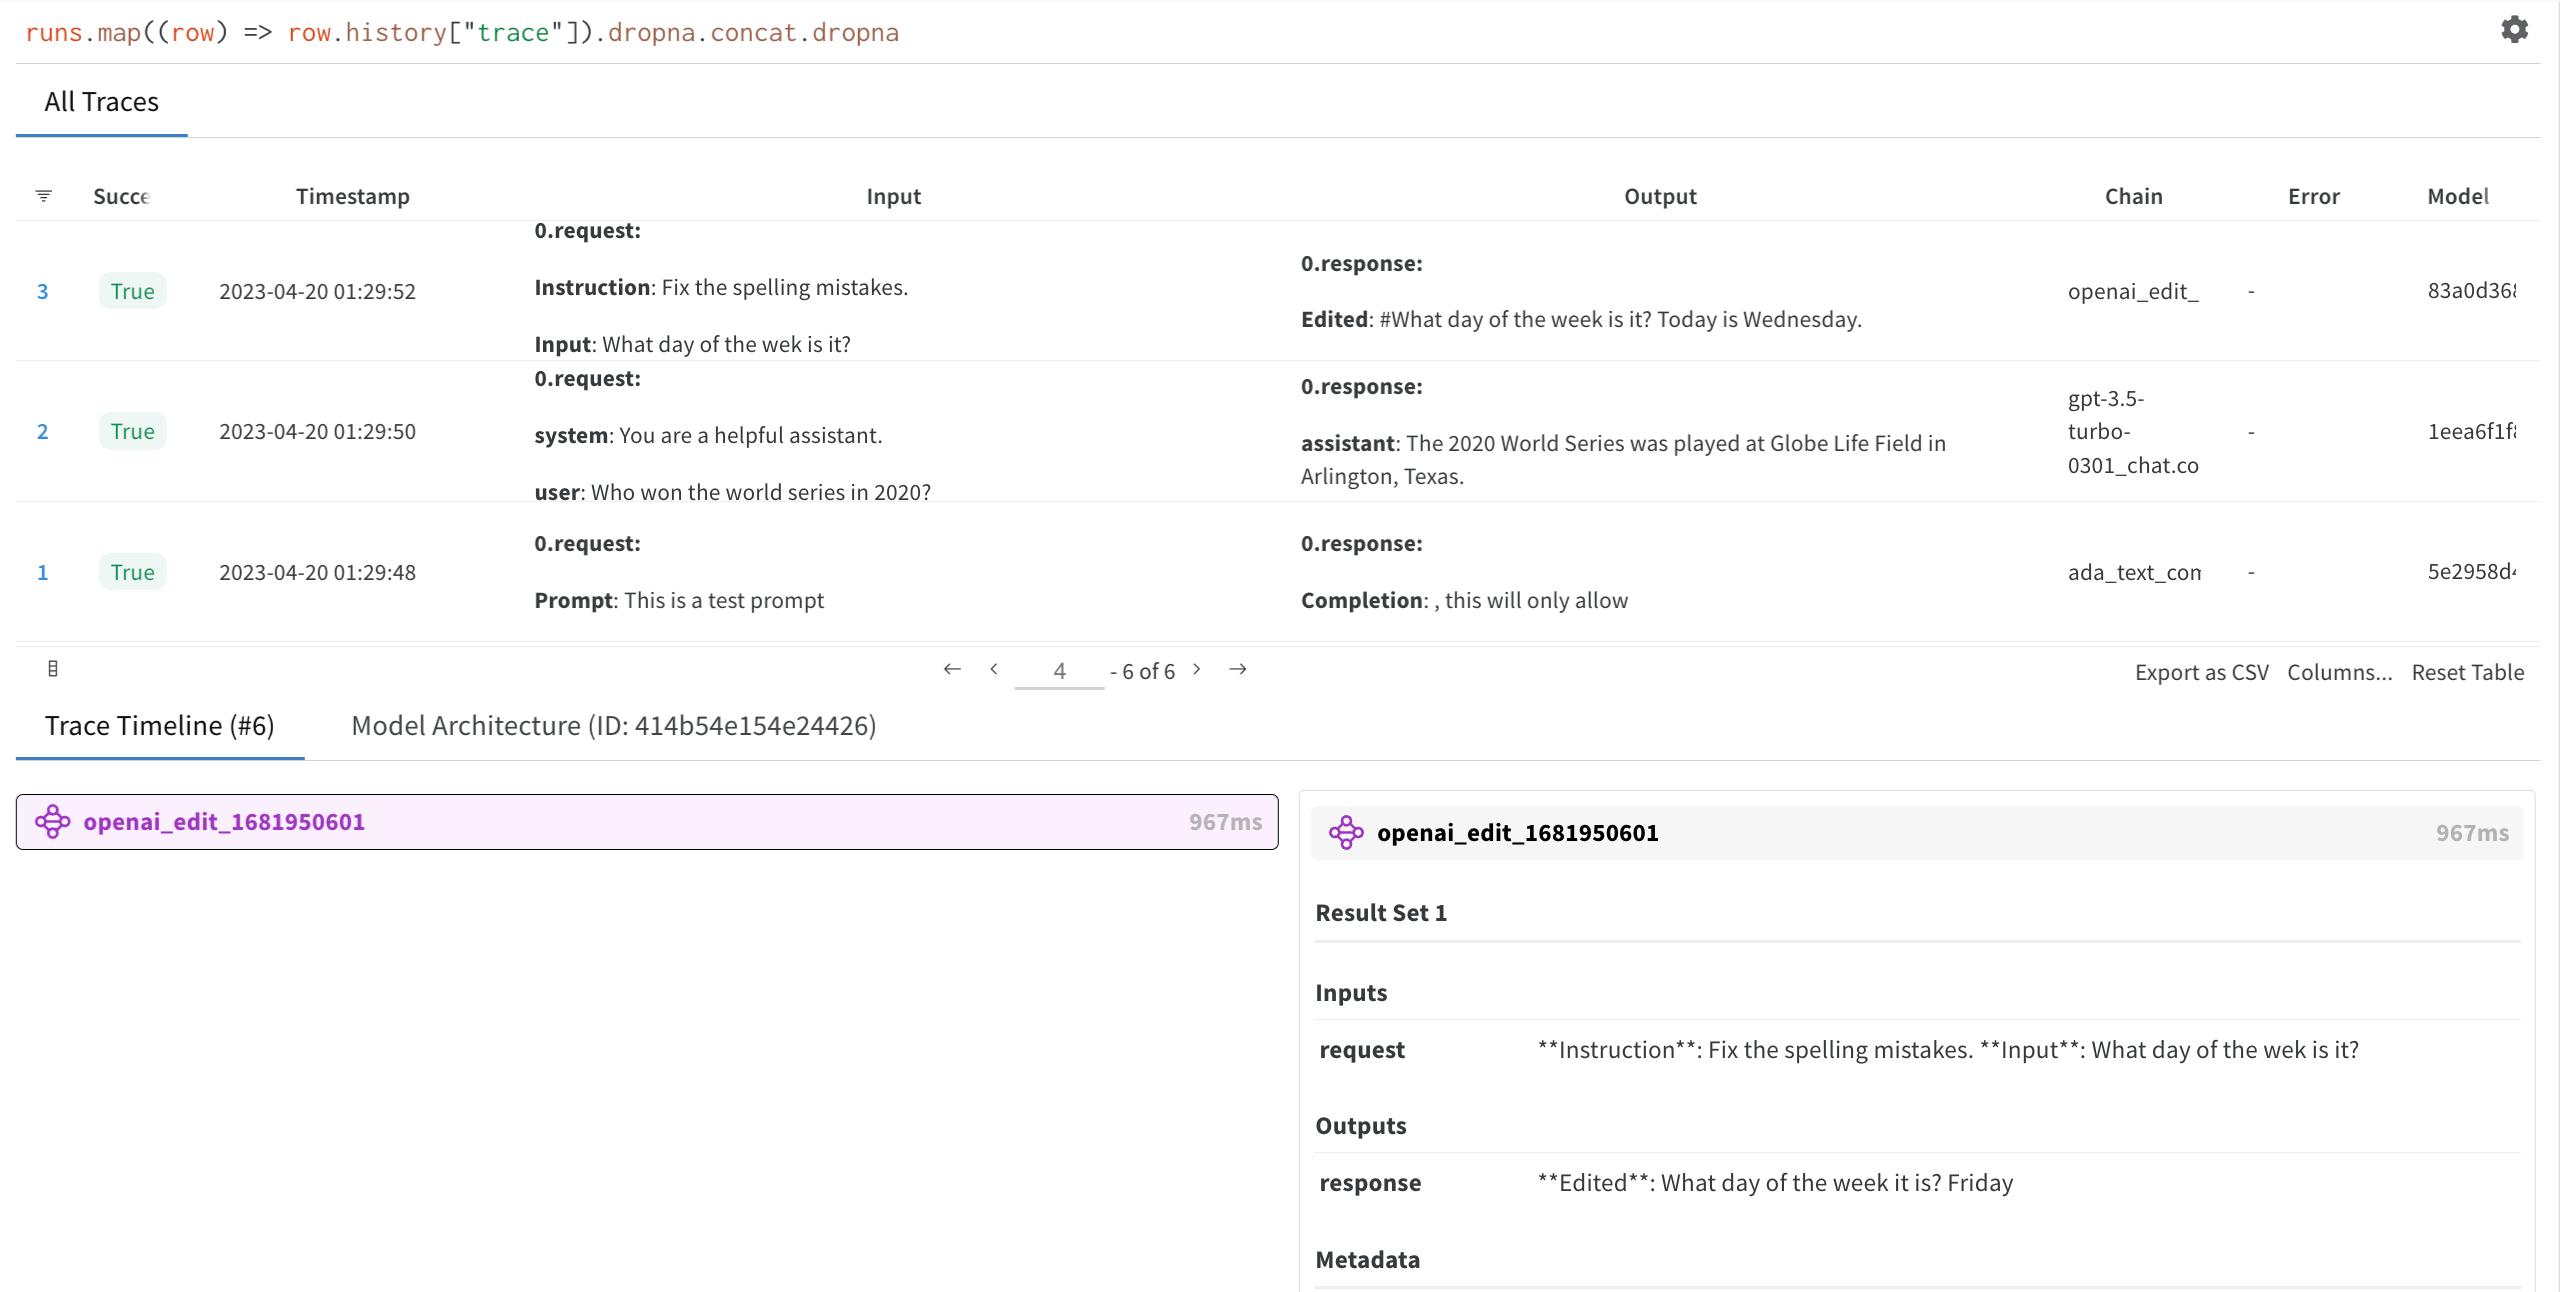
3. View your OpenAI API inputs and responses
Click on the W&B run link generated by autolog in step 1. This redirects you to your project workspace in the W&B App.
Select a run you created to view the trace table, trace timeline and the model architecture of the OpenAI LLM used.
Turn off autolog
W&B recommends that you call disable() to close all W&B processes when you are finished using the OpenAI API.
autolog.disable()
Now your inputs and completions will be logged to W&B, ready for analysis or to be shared with colleagues.
Log your OpenAI GPT-3.5 or GPT-4 model’s fine-tuning metrics and configuration to W&B. Utilize the W&B ecosystem to track your fine-tuning experiments, models, and datasets and share your results with your colleagues.
See the W&B Integration section in the OpenAI documentation for supplemental information on how to integrate W&B with OpenAI for fine-tuning.
Install or update OpenAI Python API
The W&B OpenAI fine-tuning integration works with OpenAI version 1.0 and above. See the PyPI documentation for the latest version of the OpenAI Python API library.
To install OpenAI Python API, run:
pip install openai
If you already have OpenAI Python API installed, you can update it with:
pip install -U openai
Sync your OpenAI fine-tuning results
Integrate W&B with OpenAI’s fine-tuning API to log your fine-tuning metrics and configuration to W&B. To do this, use the WandbLogger class from the wandb.integration.openai.fine_tuning module.
from wandb.integration.openai.fine_tuning import WandbLogger
# Finetuning logicWandbLogger.sync(fine_tune_job_id=FINETUNE_JOB_ID)
Sync your fine-tunes
Sync your results from your script
from wandb.integration.openai.fine_tuning import WandbLogger
# one line commandWandbLogger.sync()
# passing optional parametersWandbLogger.sync(
fine_tune_job_id=None,
num_fine_tunes=None,
project="OpenAI-Fine-Tune",
entity=None,
overwrite=False,
model_artifact_name="model-metadata",
model_artifact_type="model",
**kwargs_wandb_init
)
Reference
Argument
Description
fine_tune_job_id
This is the OpenAI Fine-Tune ID which you get when you create your fine-tune job using client.fine_tuning.jobs.create. If this argument is None (default), all the OpenAI fine-tune jobs that haven’t already been synced will be synced to W&B.
openai_client
Pass an initialized OpenAI client to sync. If no client is provided, one is initialized by the logger itself. By default it is None.
num_fine_tunes
If no ID is provided, then all the unsynced fine-tunes will be logged to W&B. This argument allows you to select the number of recent fine-tunes to sync. If num_fine_tunes is 5, it selects the 5 most recent fine-tunes.
project
W&B project name where your fine-tune metrics, models, data, etc. will be logged. By default, the project name is “OpenAI-Fine-Tune.”
entity
W&B Username or team name where you’re sending runs. By default, your default entity is used, which is usually your username.
overwrite
Forces logging and overwrite existing wandb run of the same fine-tune job. By default this is False.
wait_for_job_success
Once an OpenAI fine-tuning job is started it usually takes a bit of time. To ensure that your metrics are logged to W&B as soon as the fine-tune job is finished, this setting will check every 60 seconds for the status of the fine-tune job to change to succeeded. Once the fine-tune job is detected as being successful, the metrics will be synced automatically to W&B. Set to True by default.
model_artifact_name
The name of the model artifact that is logged. Defaults to "model-metadata".
model_artifact_type
The type of the model artifact that is logged. Defaults to "model".
**kwargs_wandb_init
Aany additional argument passed directly to wandb.init()
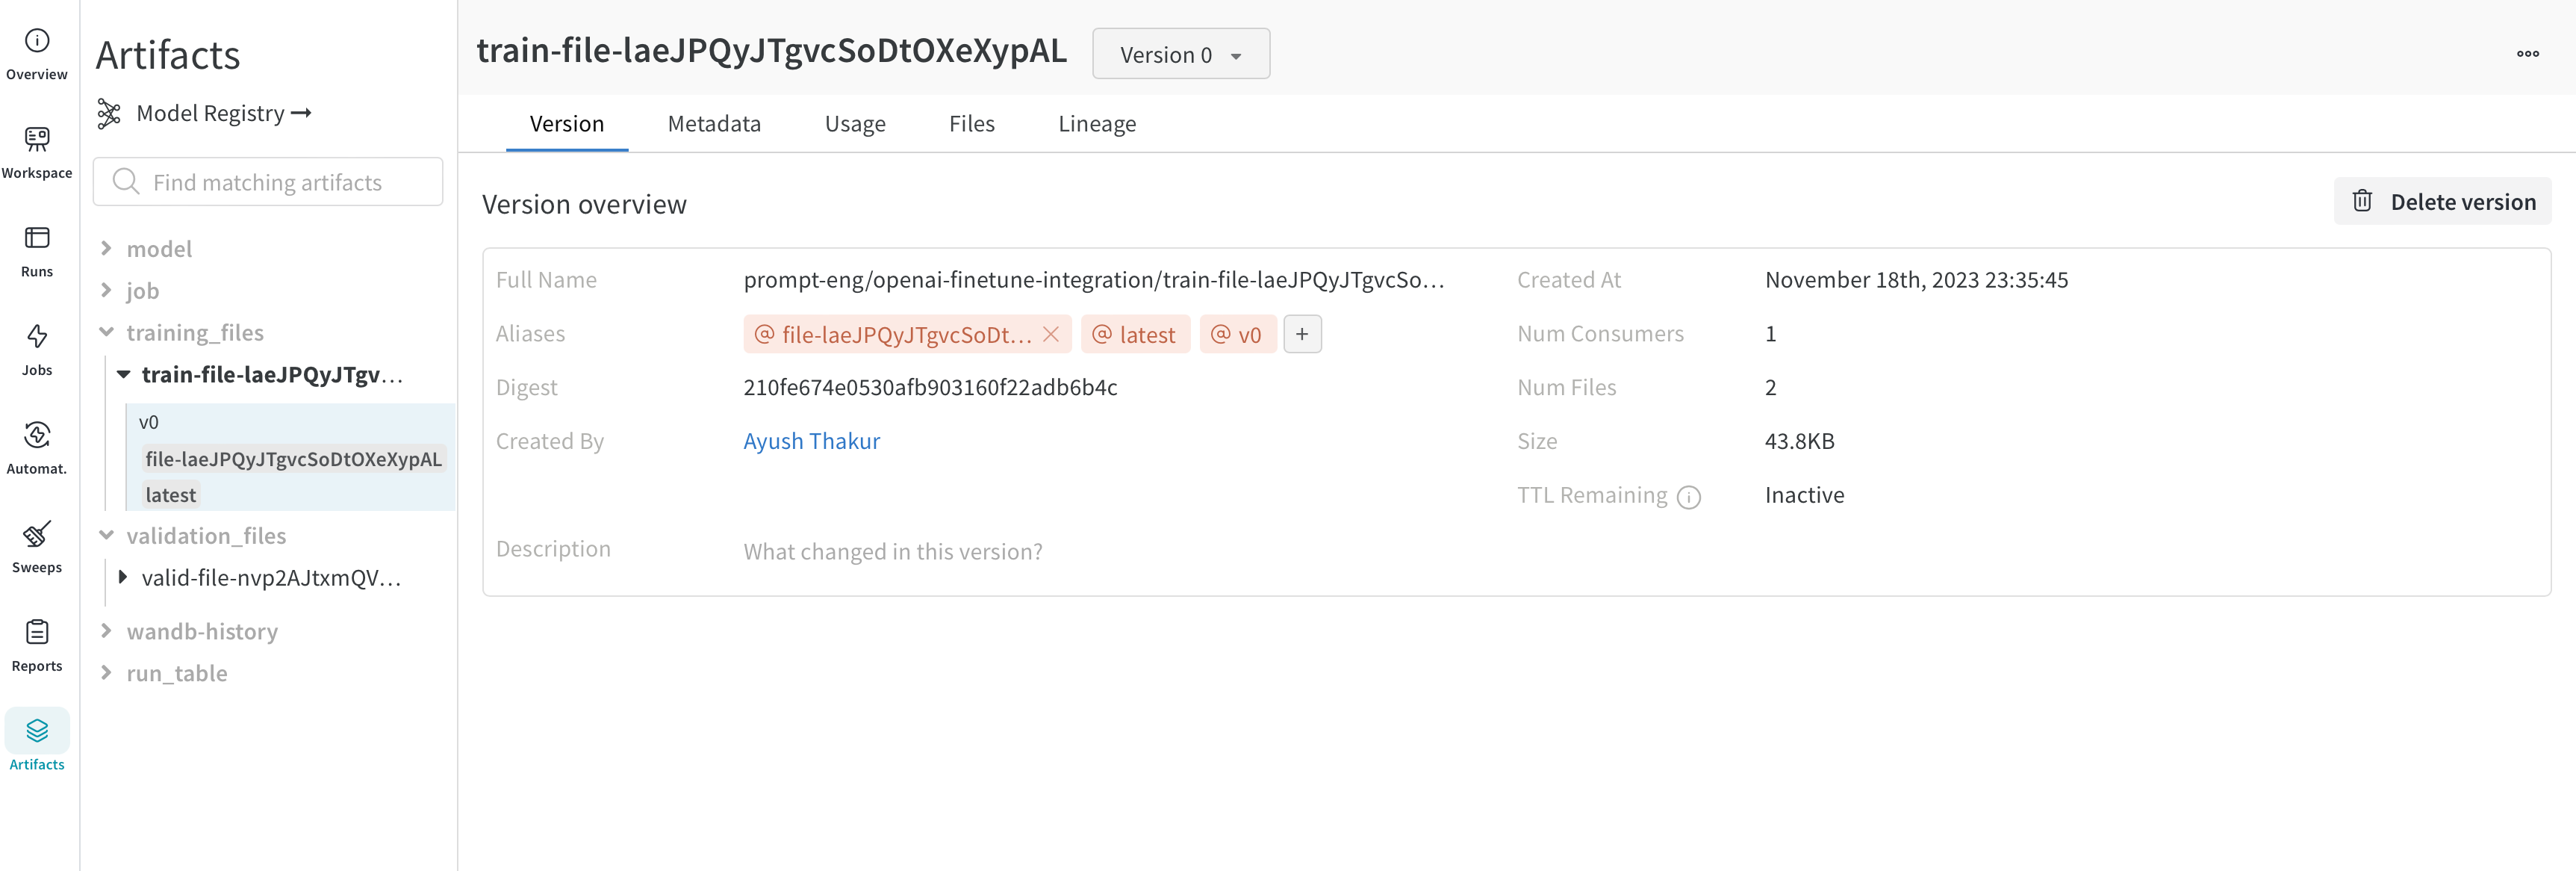
Dataset Versioning and Visualization
Versioning
The training and validation data that you upload to OpenAI for fine-tuning are automatically logged as W&B Artifacts for easier version control. Below is an view of the training file in Artifacts. Here you can see the W&B run that logged this file, when it was logged, what version of the dataset this is, the metadata, and DAG lineage from the training data to the trained model.
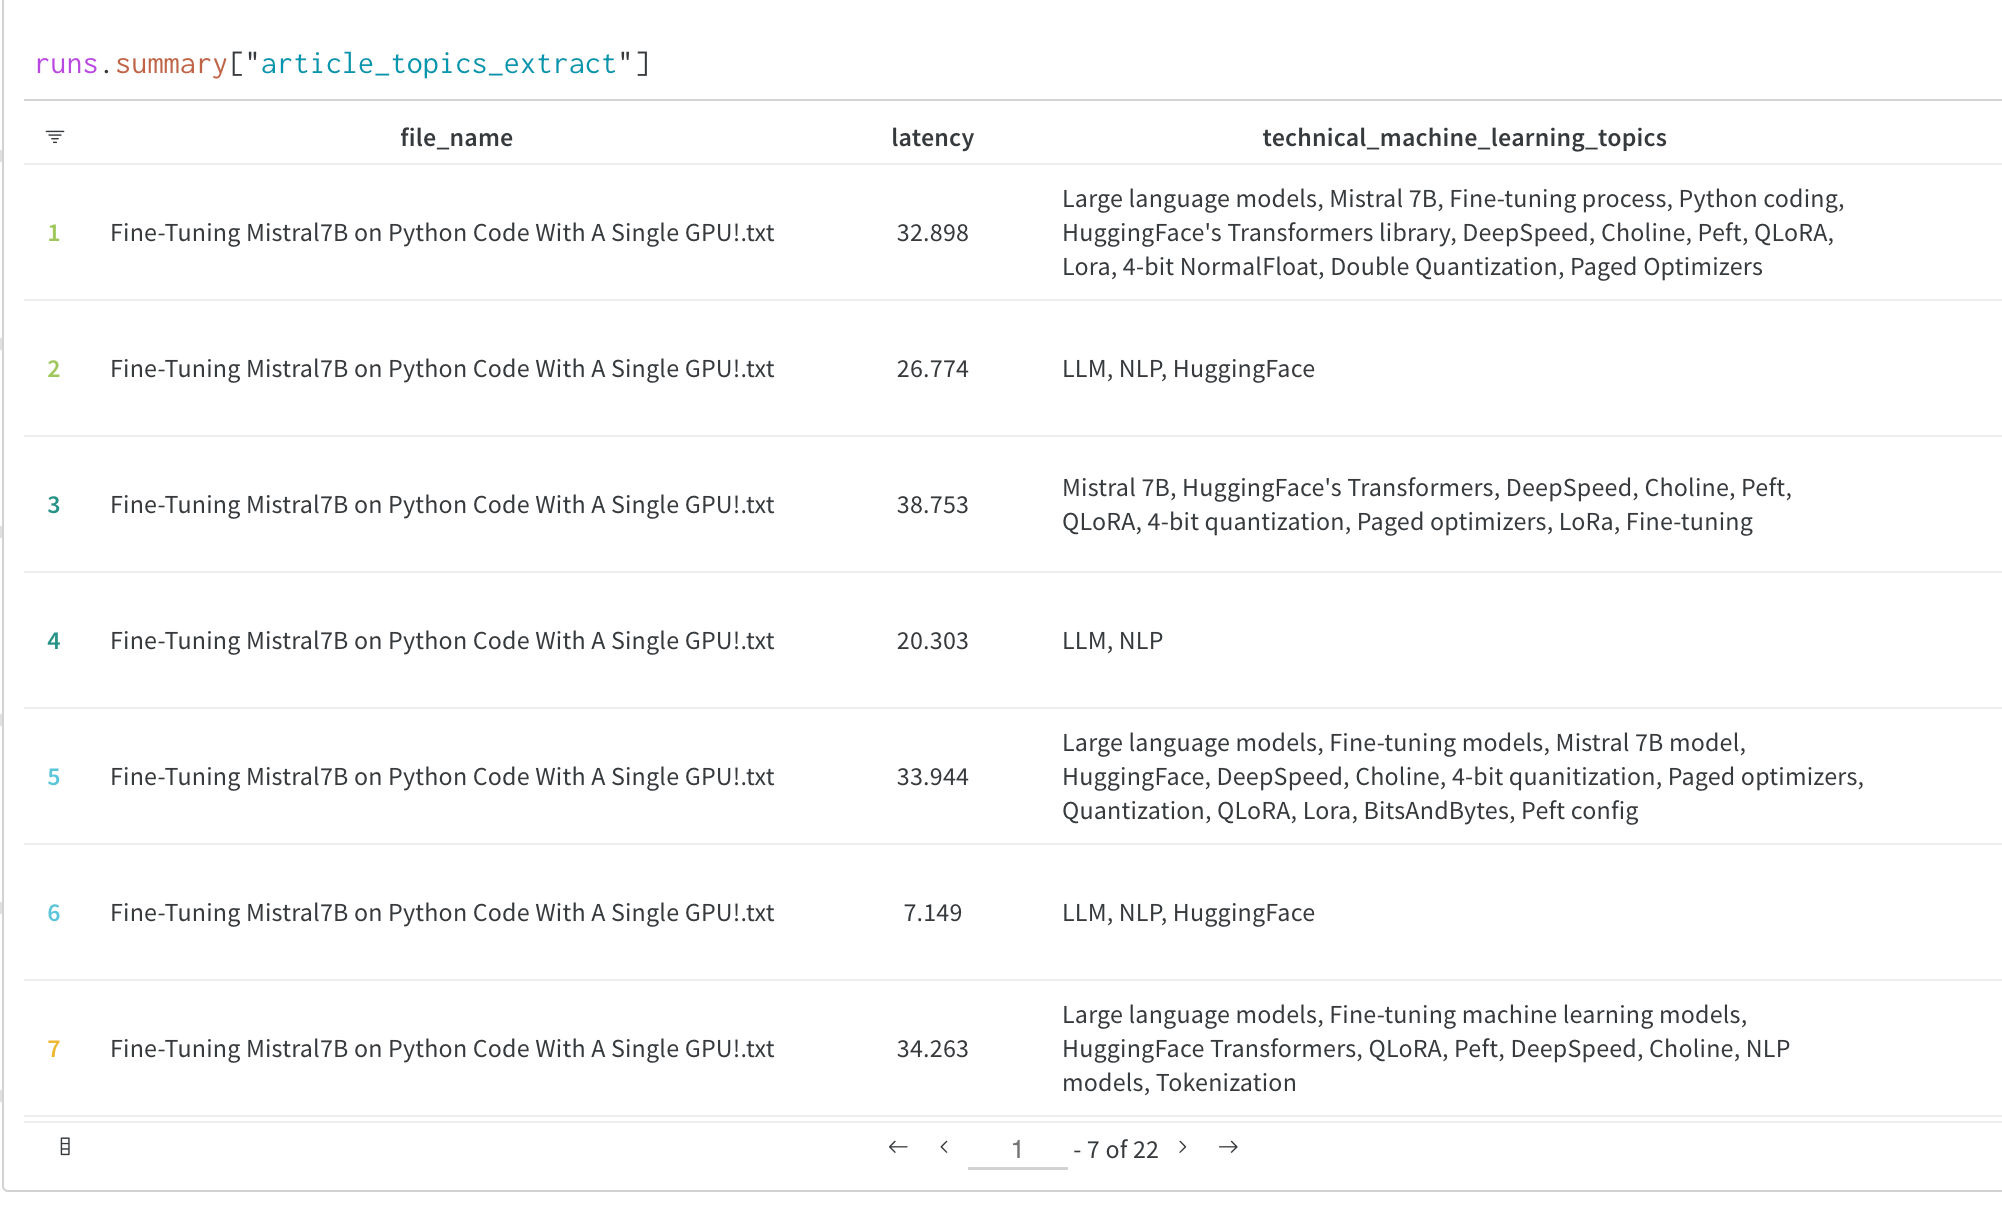
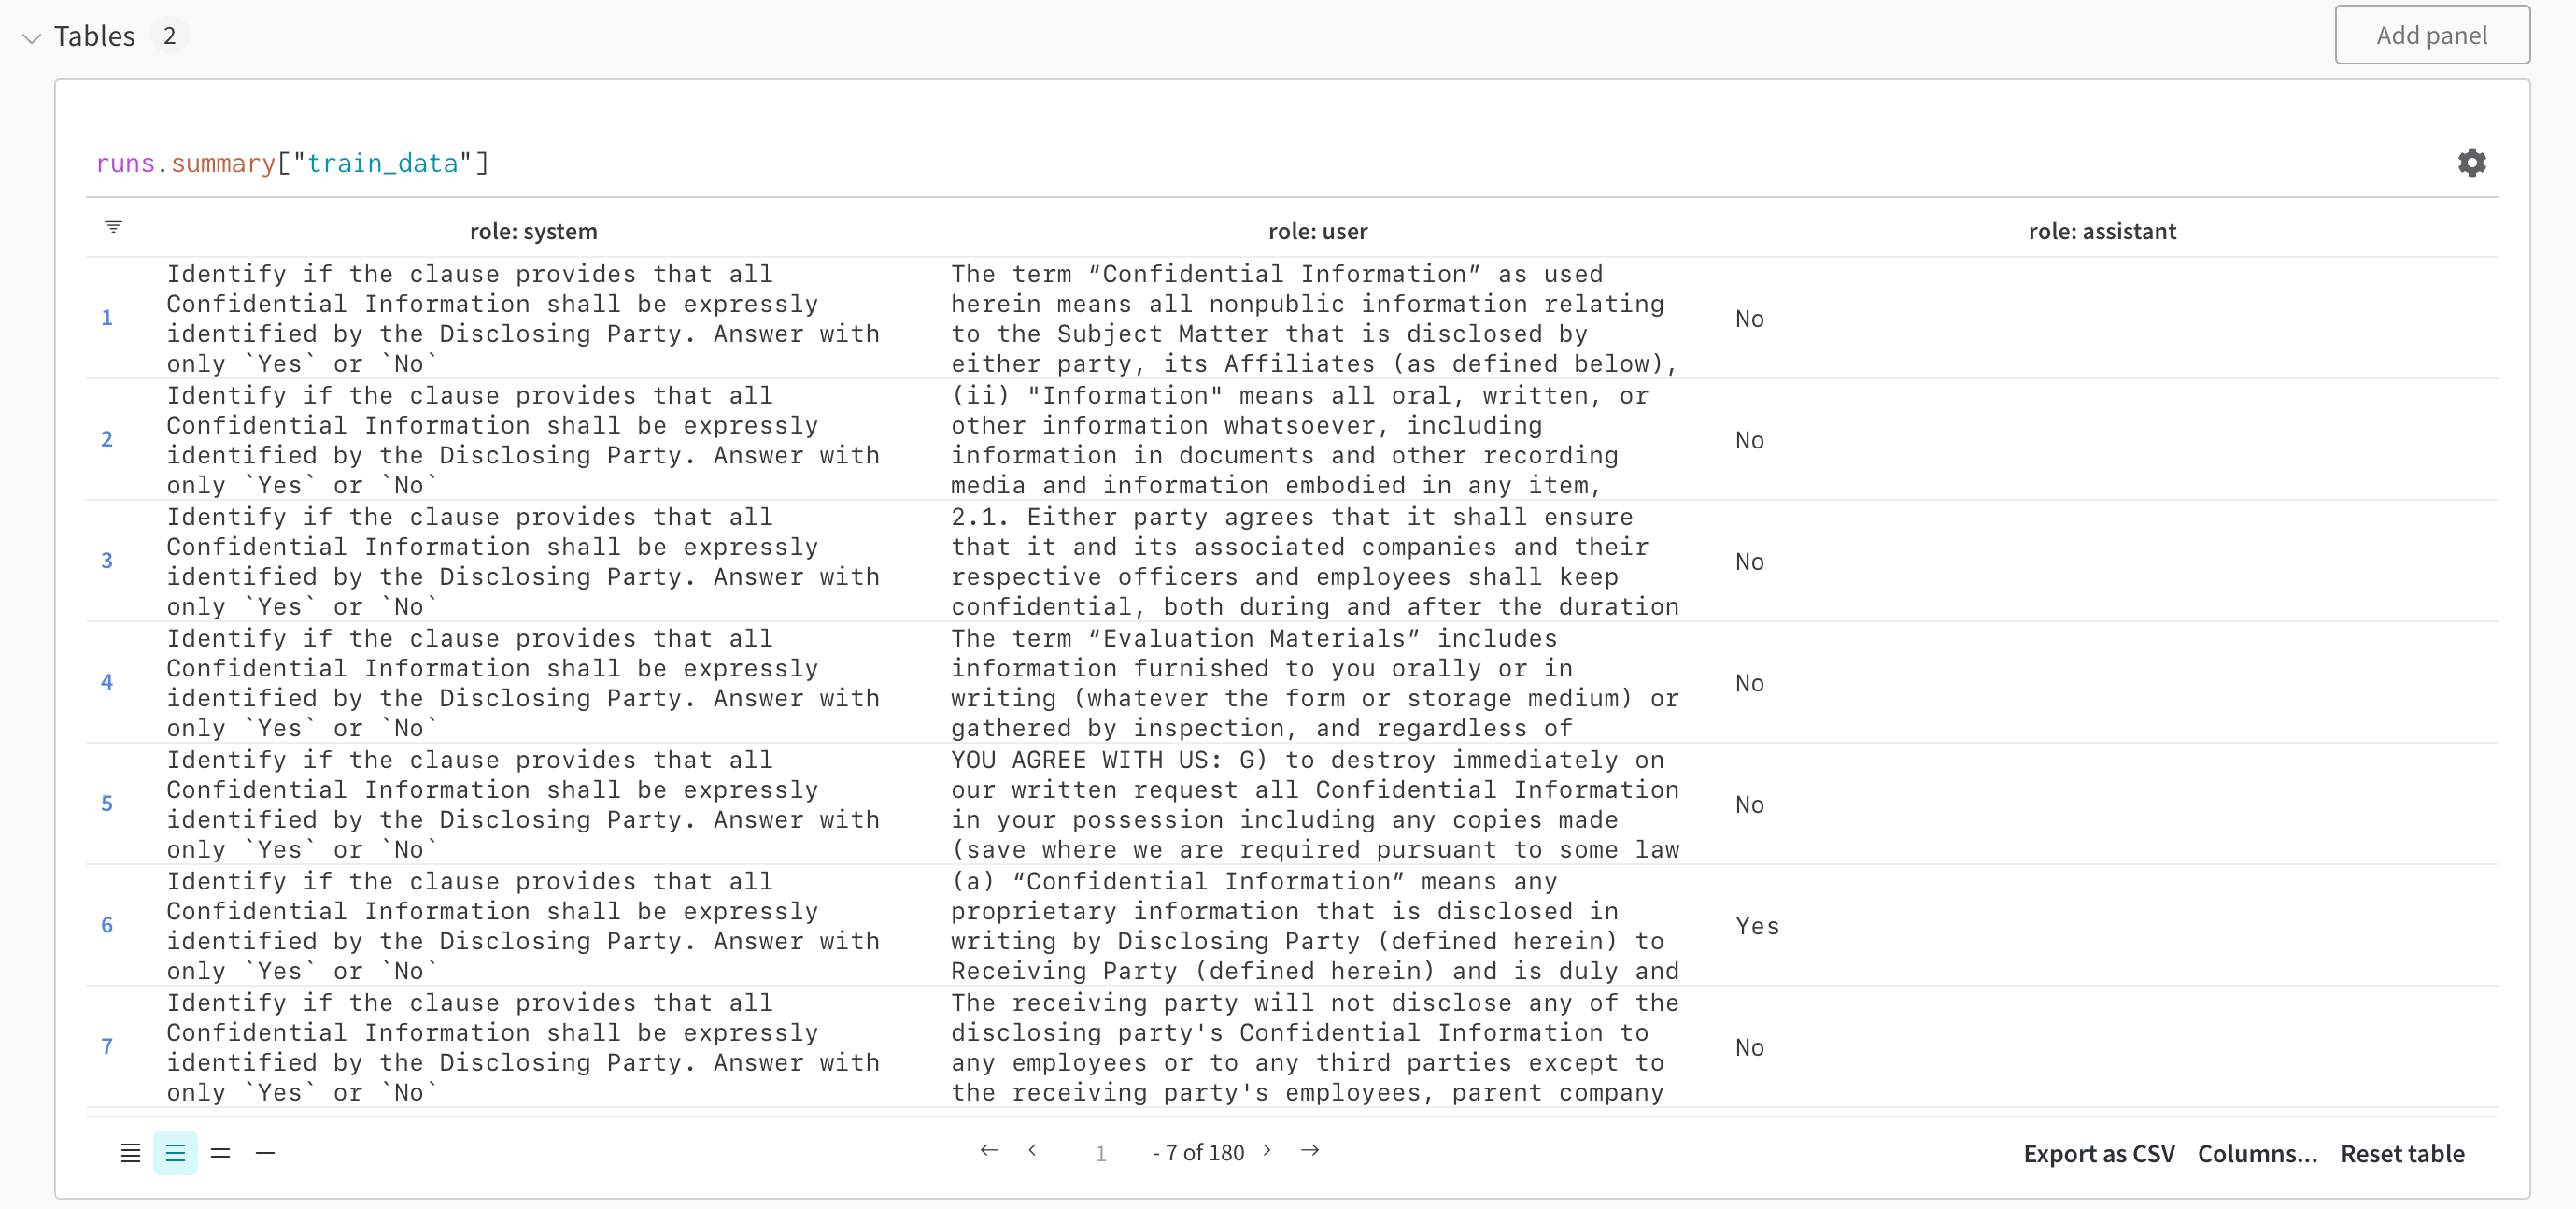
Visualization
The datasets are visualized as W&B Tables, which allows you to explore, search, and interact with the dataset. Check out the training samples visualized using W&B Tables below.
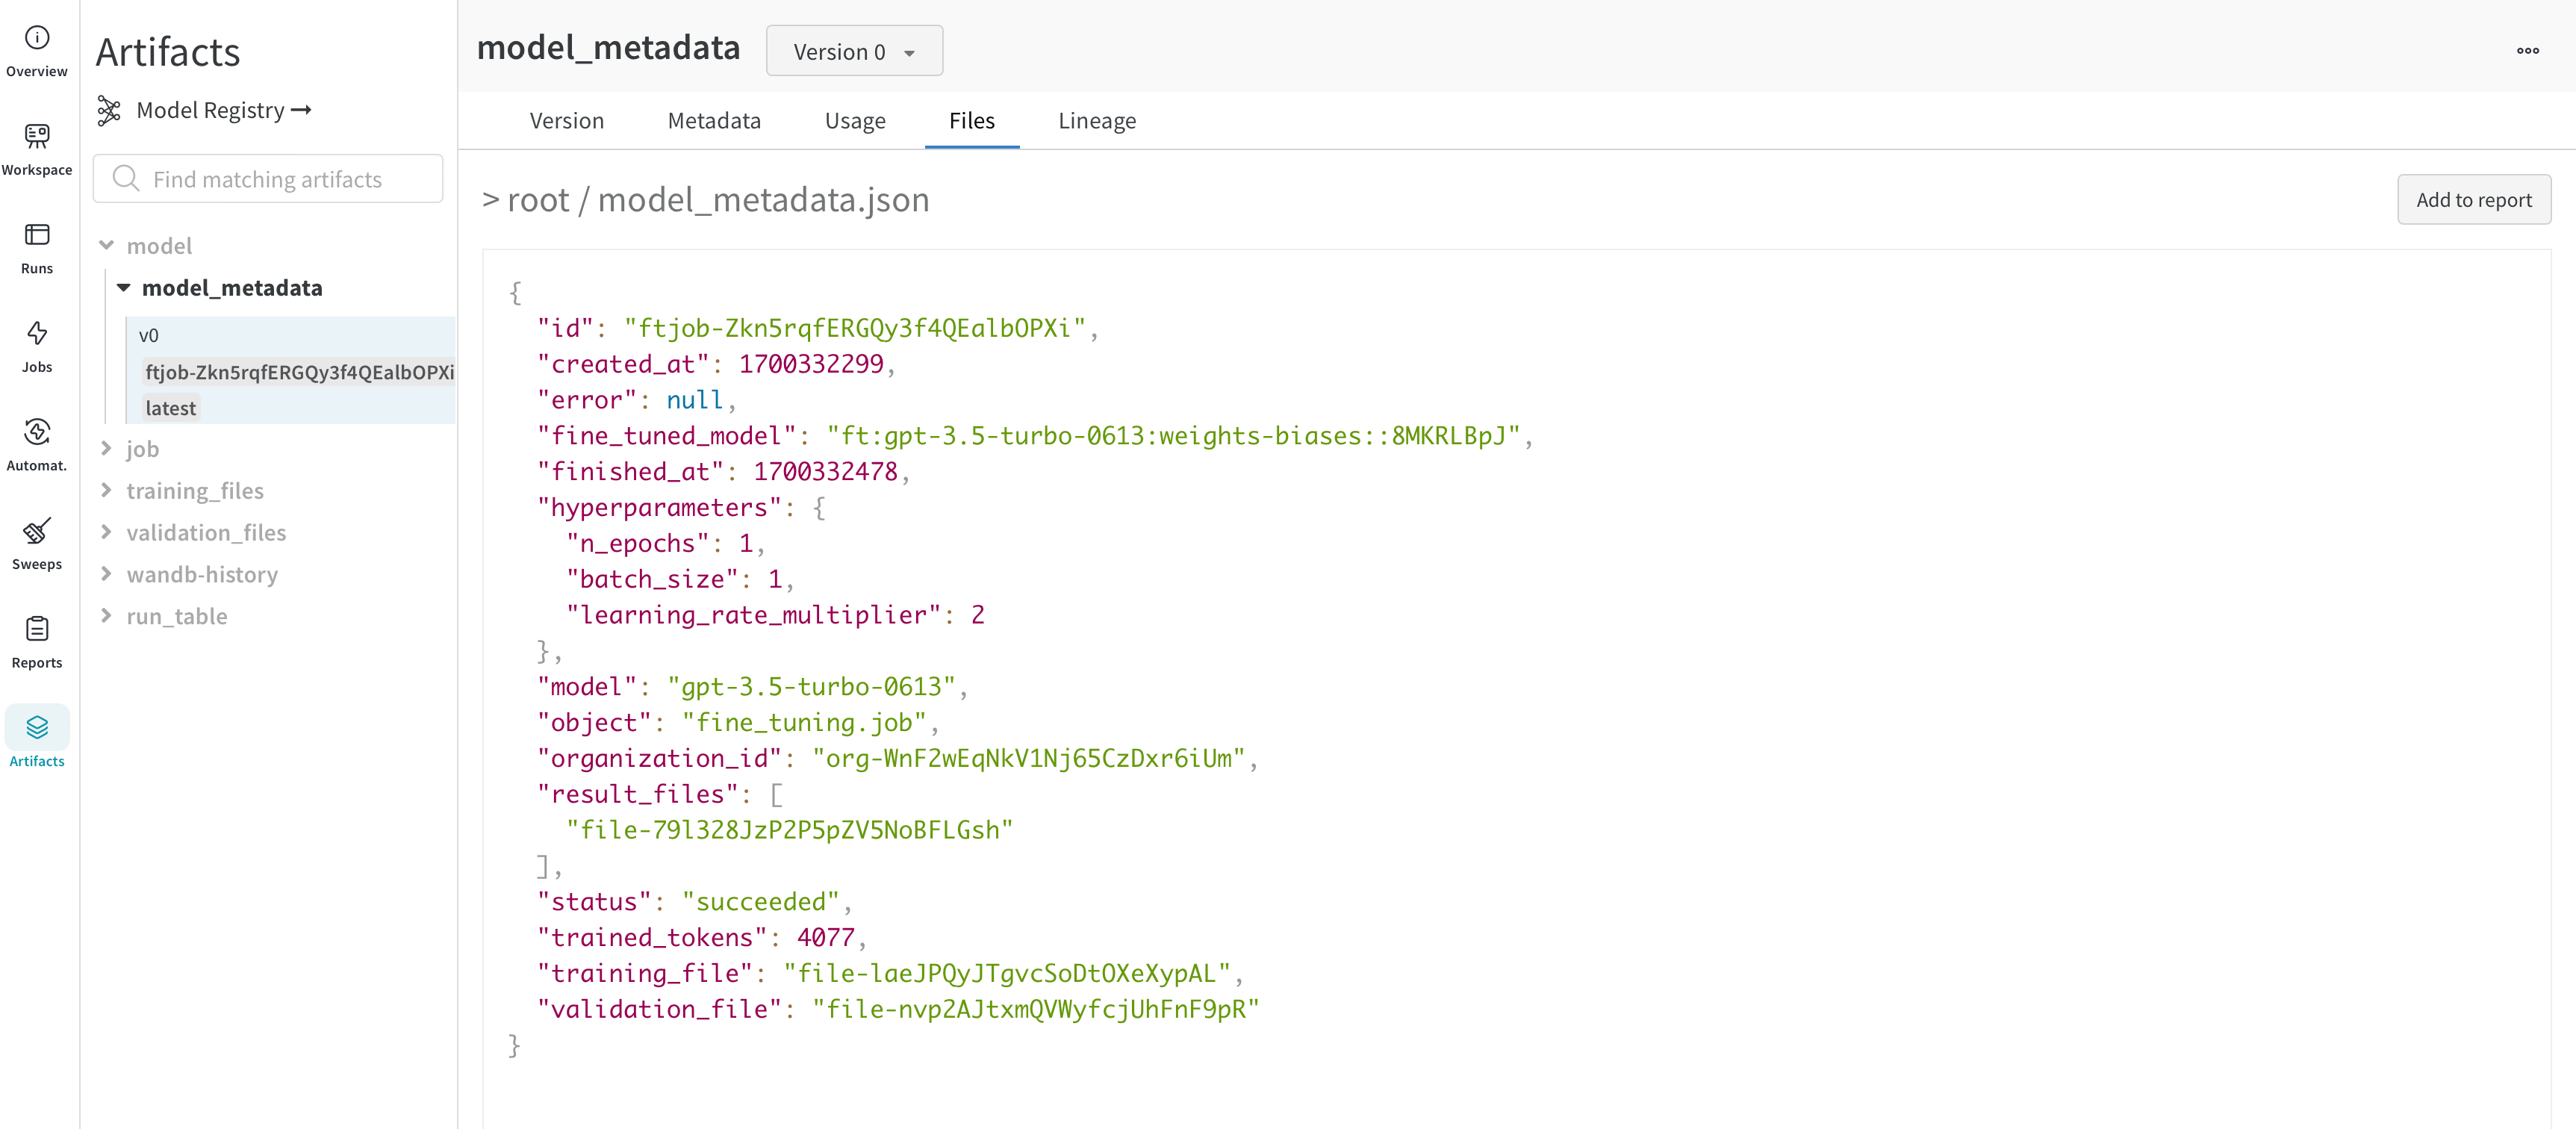
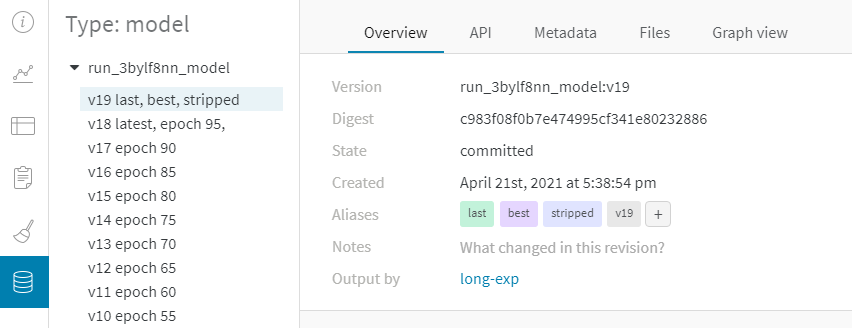
The fine-tuned model and model versioning
OpenAI gives you an id of the fine-tuned model. Since we don’t have access to the model weights, the WandbLogger creates a model_metadata.json file with all the details (hyperparameters, data file ids, etc.) of the model along with the `fine_tuned_model`` id and is logged as a W&B Artifact.
This model (metadata) artifact can further be linked to a model in the W&B Registry.
Frequently Asked Questions
How do I share my fine-tune results with my team in W&B?
Log your fine-tune jobs to your team account with:
WandbLogger.sync(entity="YOUR_TEAM_NAME")
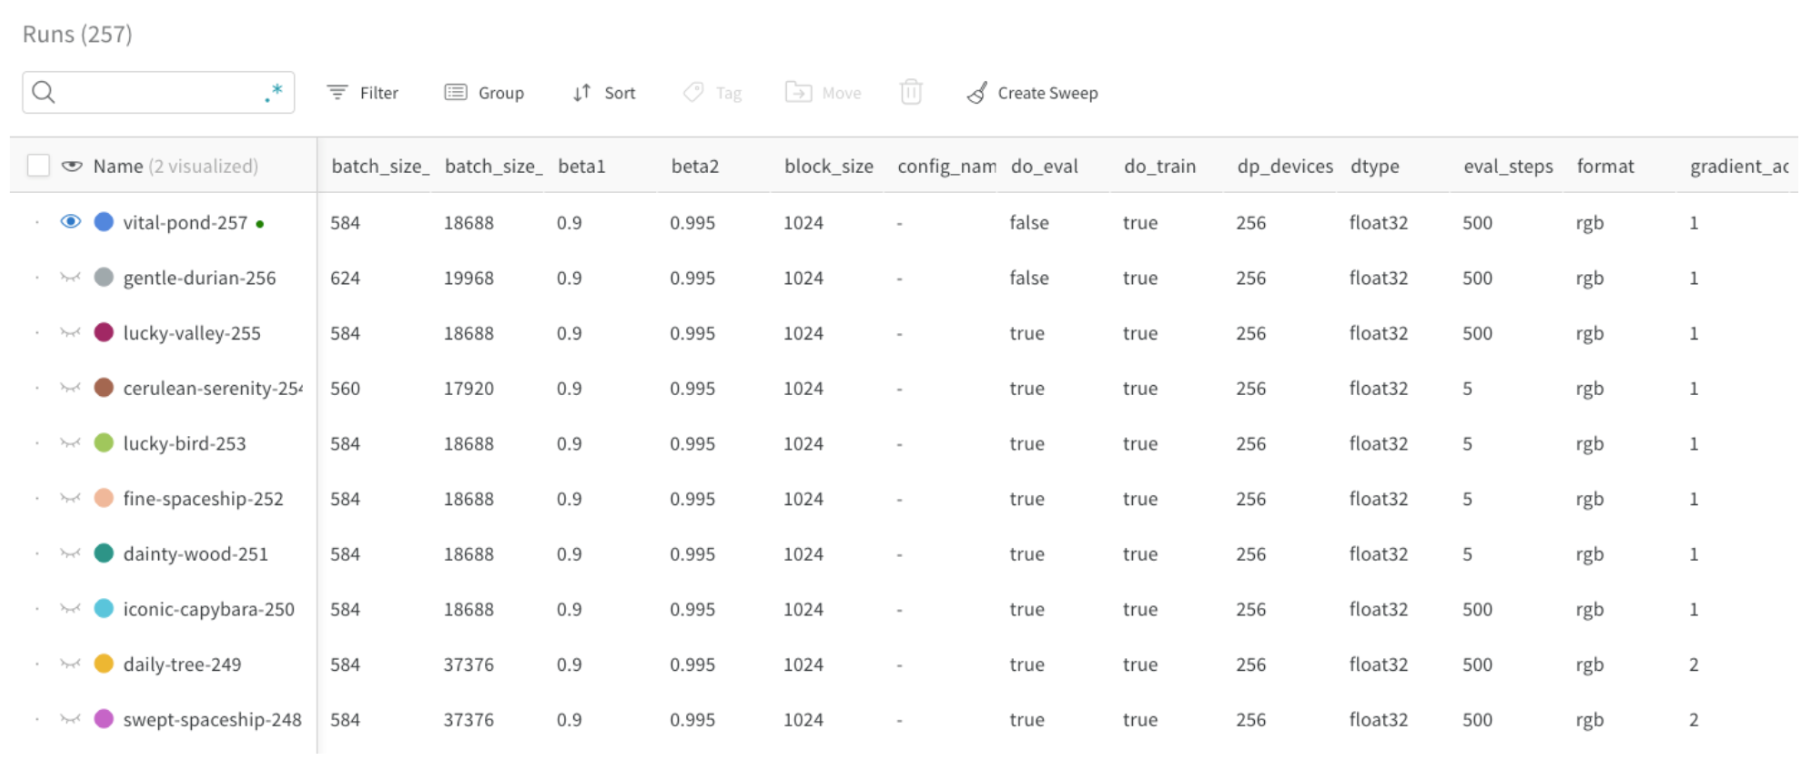
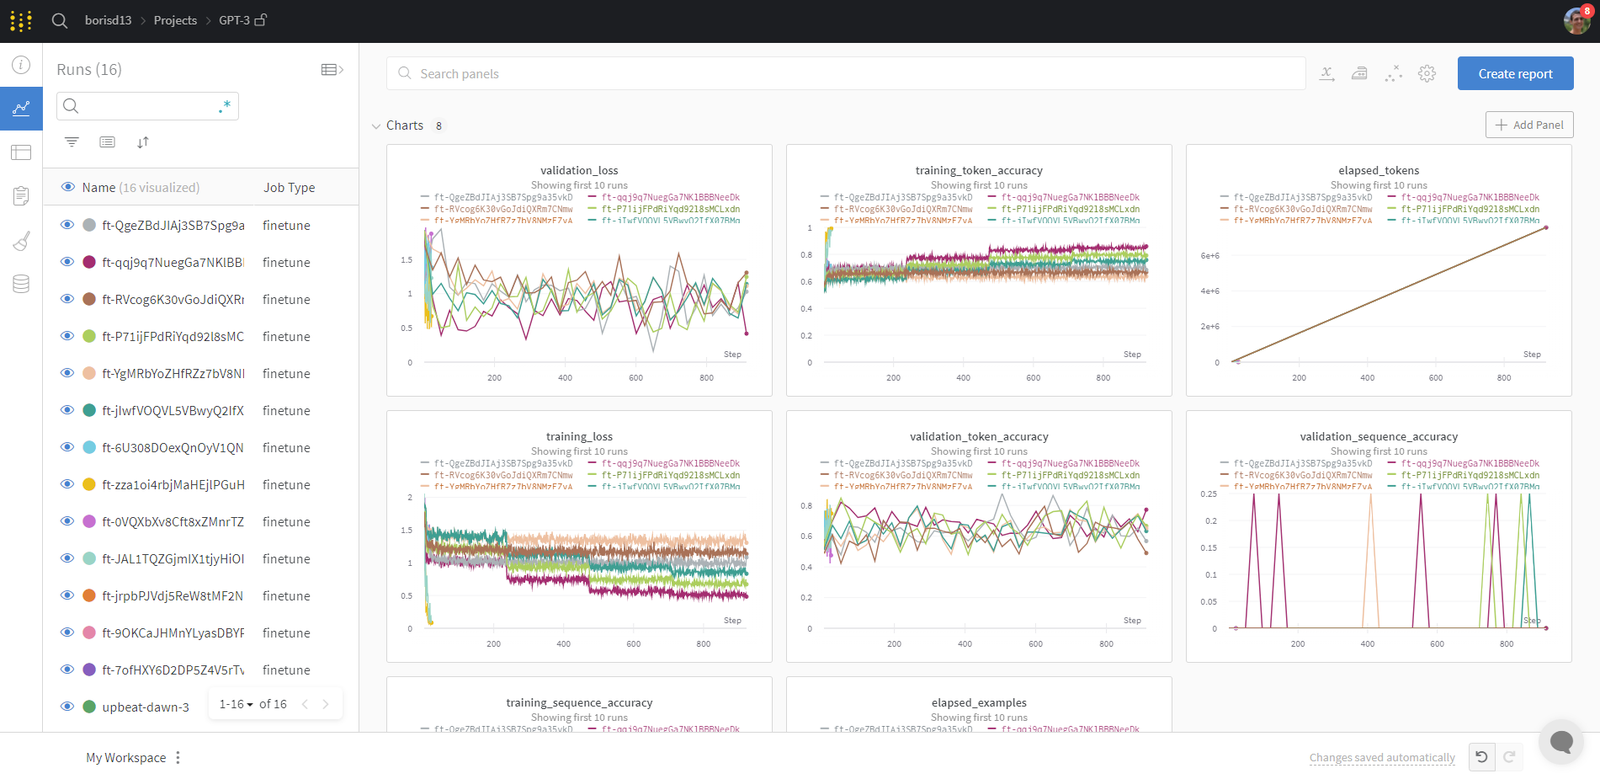
How can I organize my runs?
Your W&B runs are automatically organized and can be filtered/sorted based on any configuration parameter such as job type, base model, learning rate, training filename and any other hyper-parameter.
In addition, you can rename your runs, add notes or create tags to group them.
Once you’re satisfied, you can save your workspace and use it to create report, importing data from your runs and saved artifacts (training/validation files).
How can I access my fine-tuned model?
Fine-tuned model ID is logged to W&B as artifacts (model_metadata.json) as well config.
import wandb

with wandb.init(project="OpenAI-Fine-Tune", entity="YOUR_TEAM_NAME") as run:
    ft_artifact = run.use_artifact("ENTITY/PROJECT/model_metadata:VERSION")
    artifact_dir = ft_artifact.download()
where VERSION is either:
a version number such as v2
the fine-tune id such as ft-xxxxxxxxx
an alias added automatically such as latest or manually
You can then access fine_tuned_model id by reading the downloaded model_metadata.json file.
What if a fine-tune was not synced successfully?
If a fine-tune was not logged to W&B successfully, you can use the overwrite=True and pass the fine-tune job id:
The training and validation data are logged automatically to W&B as artifacts. The metadata including the ID for the fine-tuned model is also logged as artifacts.
You can always control the pipeline using low level wandb APIs like wandb.Artifact, wandb.Run.log, etc. This will allow complete traceability of your data and models.
“The team that has been maintaining Gym since 2021 has moved all future development to Gymnasium, a drop in replacement for Gym (import gymnasium as gym), and Gym will not be receiving any future updates.” (Source)
Since Gym is no longer an actively maintained project, try out our integration with Gymnasium.
If you’re using OpenAI Gym, W&B automatically logs videos of your environment generated by gym.wrappers.Monitor. Just set the monitor_gym keyword argument to wandb.init to True or call wandb.gym.monitor().
Our gym integration is very light. We simply look at the name of the video file being logged from gym and name it after that or fall back to "videos" if we don’t find a match. If you want more control, you can always just manually log a video.
PyTorch is one of the most popular frameworks for deep learning in Python, especially among researchers. W&B provides first class support for PyTorch, from logging gradients to profiling your code on the CPU and GPU.
To automatically log gradients, you can call wandb.Run.watch() and pass in your PyTorch model.
import wandb
with wandb.init(config=args) as run:
model =...# set up your model# Magic run.watch(model, log_freq=100)
model.train()
for batch_idx, (data, target) in enumerate(train_loader):
output = model(data)
loss = F.nll_loss(output, target)
loss.backward()
optimizer.step()
if batch_idx % args.log_interval ==0:
run.log({"loss": loss})
If you need to track multiple models in the same script, you can call wandb.Run.watch() on each model separately.
Gradients, metrics, and the graph won’t be logged until wandb.Run.log() is called after a forward and backward pass.
Log images and media
You can pass PyTorch Tensors with image data into wandb.Image and utilities from torchvision will be used to convert them to images automatically:
with wandb.init(project="my_project", entity="my_entity") as run:
images_t =...# generate or load images as PyTorch Tensors run.log({"examples": [wandb.Image(im) for im in images_t]})
For more on logging rich media to W&B in PyTorch and other frameworks, check out our media logging guide.
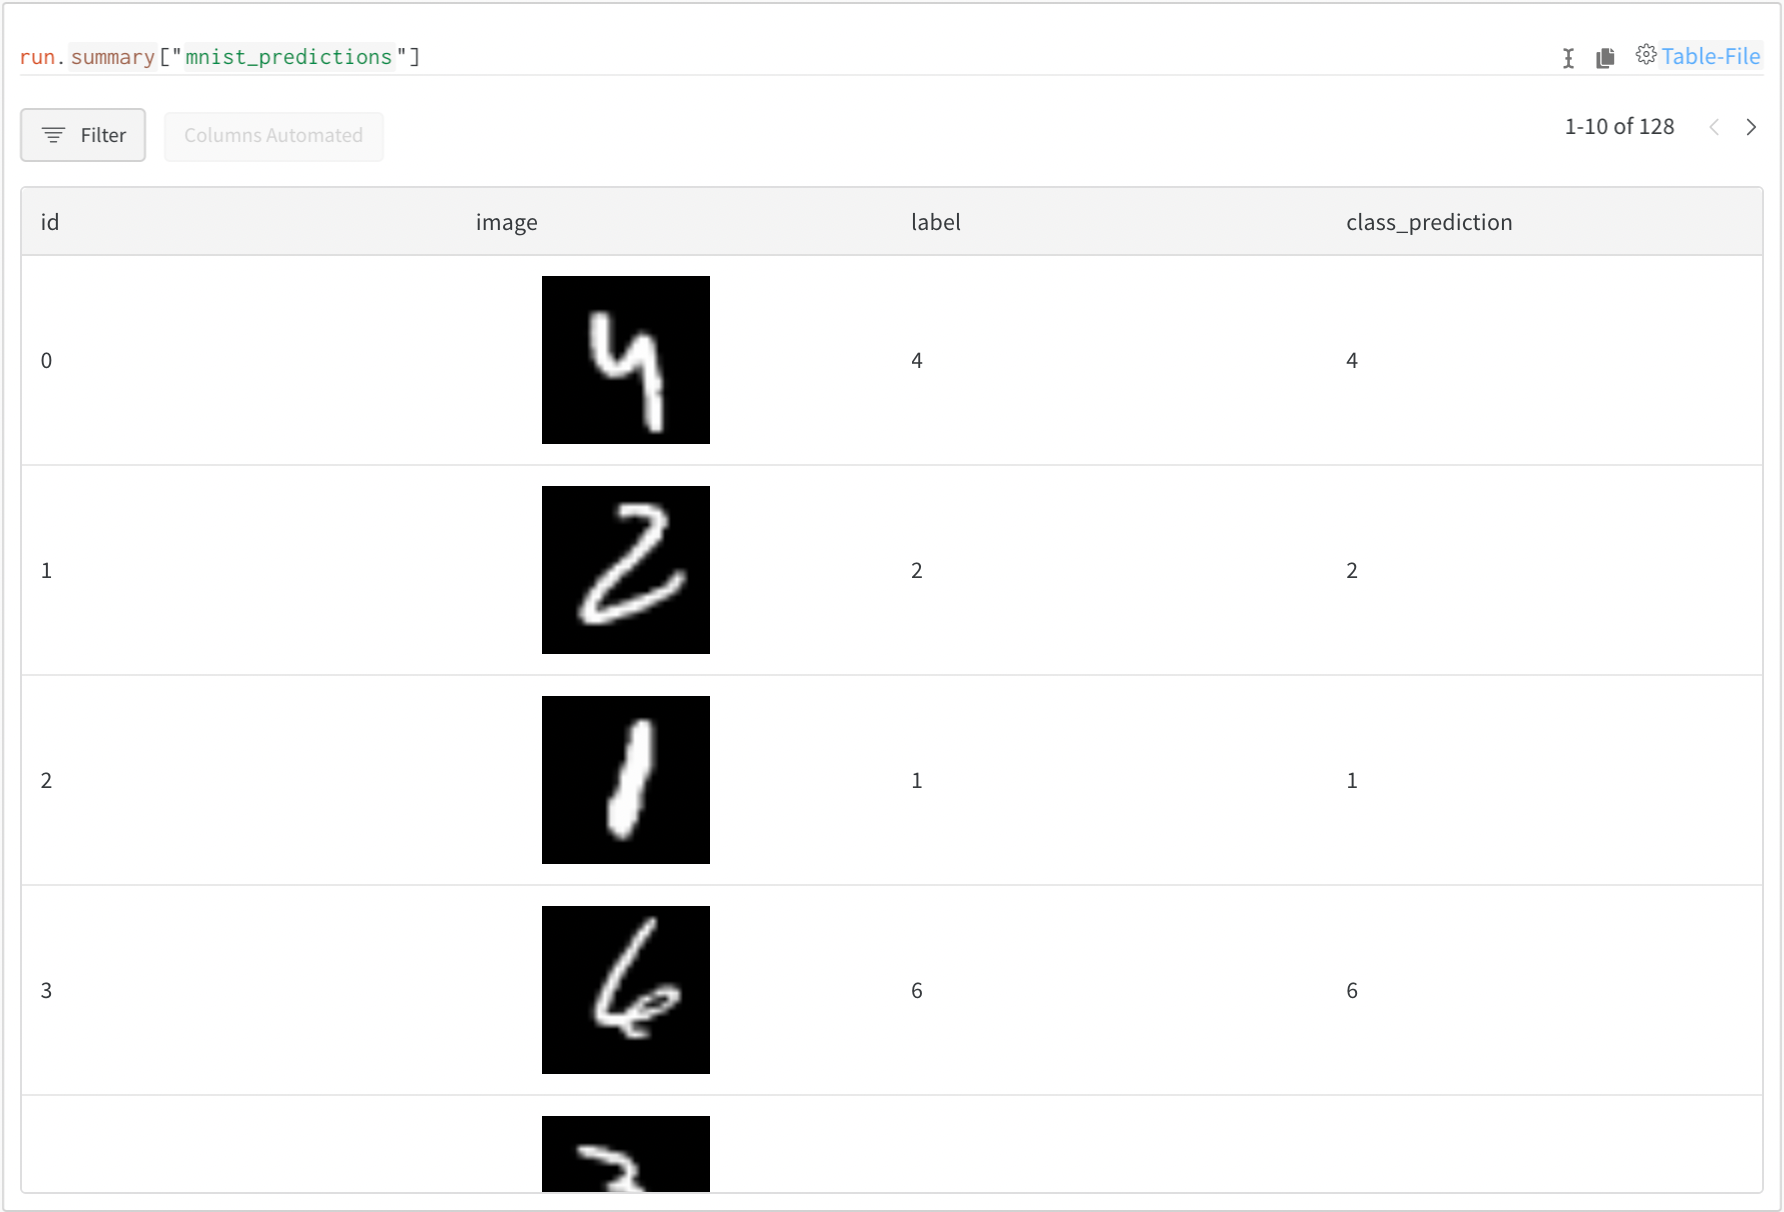
If you also want to include information alongside media, like your model’s predictions or derived metrics, use a wandb.Table.
with wandb.init() as run:
    my_table = wandb.Table()

    my_table.add_column("image", images_t)
    my_table.add_column("label", labels)
    my_table.add_column("class_prediction", predictions_t)

    # Log your Table to W&B
    run.log({"mnist_predictions": my_table})
For more on logging and visualizing datasets and models, check out our guide to W&B Tables.
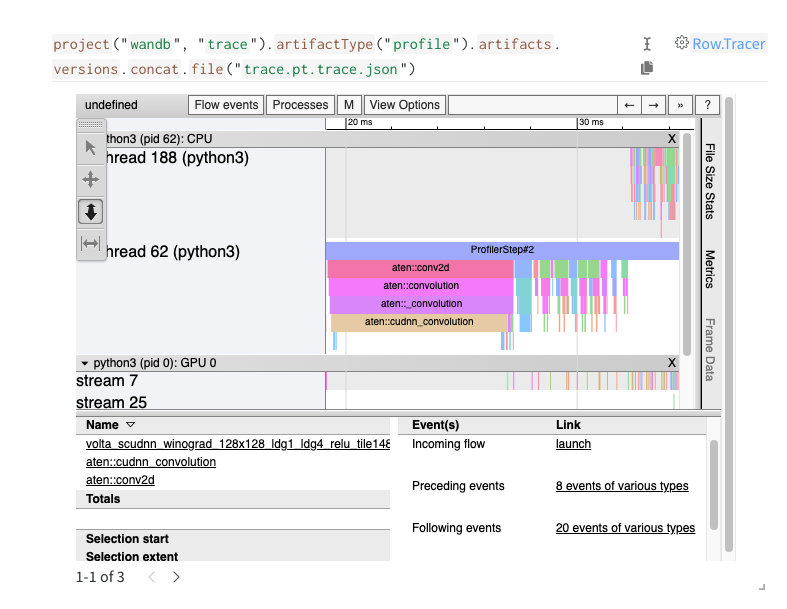
Profile PyTorch code
W&B integrates directly with PyTorch Kineto’s Tensorboard plugin to provide tools for profiling PyTorch code, inspecting the details of CPU and GPU communication, and identifying bottlenecks and optimizations.
profile_dir ="path/to/run/tbprofile/"profiler = torch.profiler.profile(
schedule=schedule, # see the profiler docs for details on scheduling on_trace_ready=torch.profiler.tensorboard_trace_handler(profile_dir),
with_stack=True,
)
with profiler:
...# run the code you want to profile here# see the profiler docs for detailed usage information# create a wandb Artifactprofile_art = wandb.Artifact("trace", type="profile")
# add the pt.trace.json files to the Artifactprofile_art.add_file(glob.glob(profile_dir +".pt.trace.json"))
# log the artifactprofile_art.save()
The interactive trace viewing tool is based on the Chrome Trace Viewer, which works best with the Chrome browser.
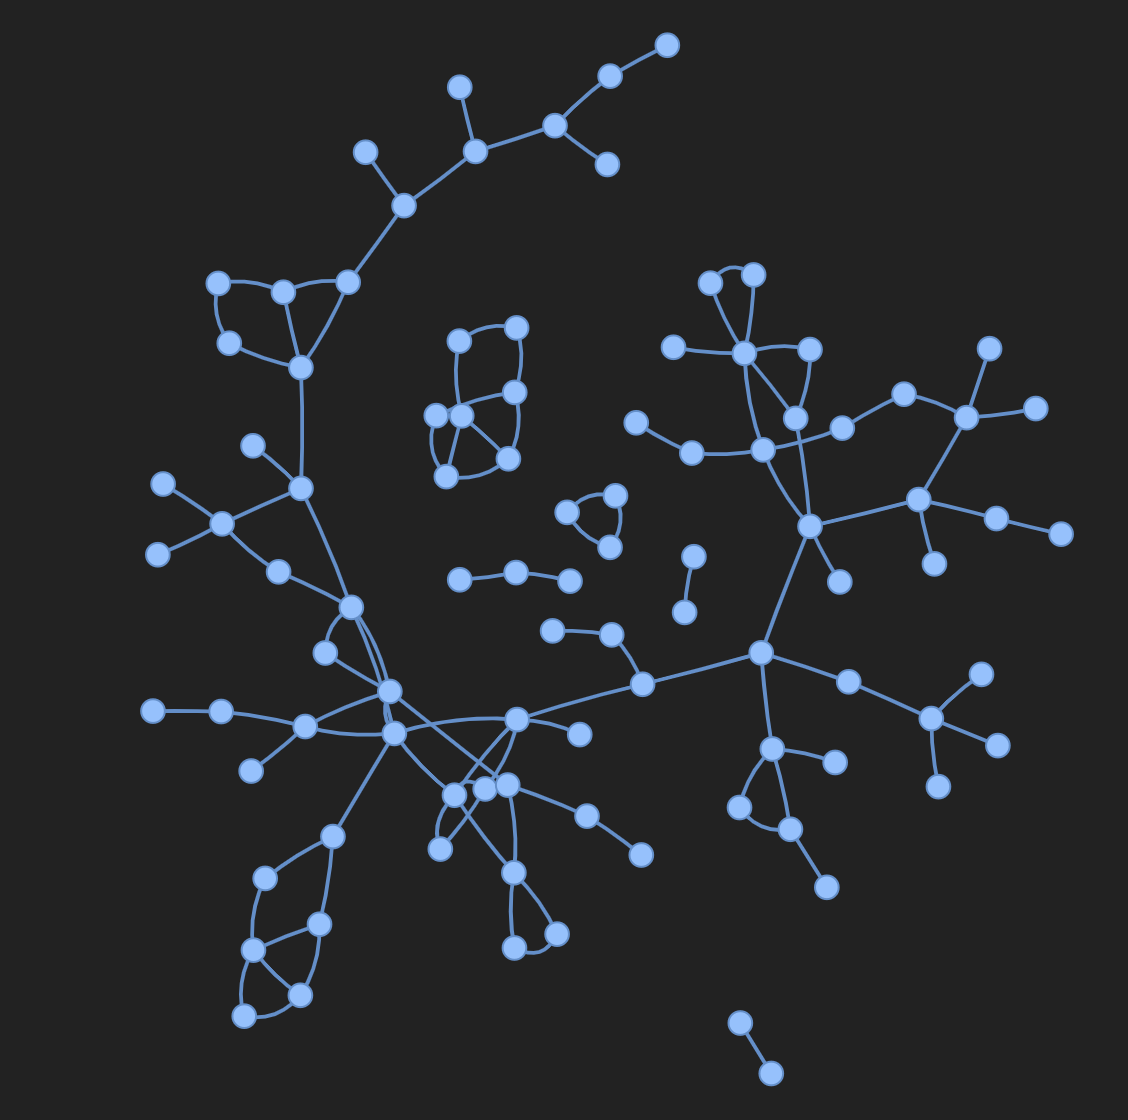
10 - PyTorch Geometric
PyTorch Geometric or PyG is one of the most popular libraries for geometric deep learning and W&B works extremely well with it for visualizing graphs and tracking experiments.
After you have installed Pytorch Geometric, follow these steps to get started.
Sign up and create an API key
An API key authenticates your machine to W&B. You can generate an API key from your user profile.
For a more streamlined approach, you can generate an API key by going directly to the W&B authorization page. Copy the displayed API key and save it in a secure location such as a password manager.
Click your user profile icon in the upper right corner.
Select User Settings, then scroll to the API Keys section.
Click Reveal. Copy the displayed API key. To hide the API key, reload the page.
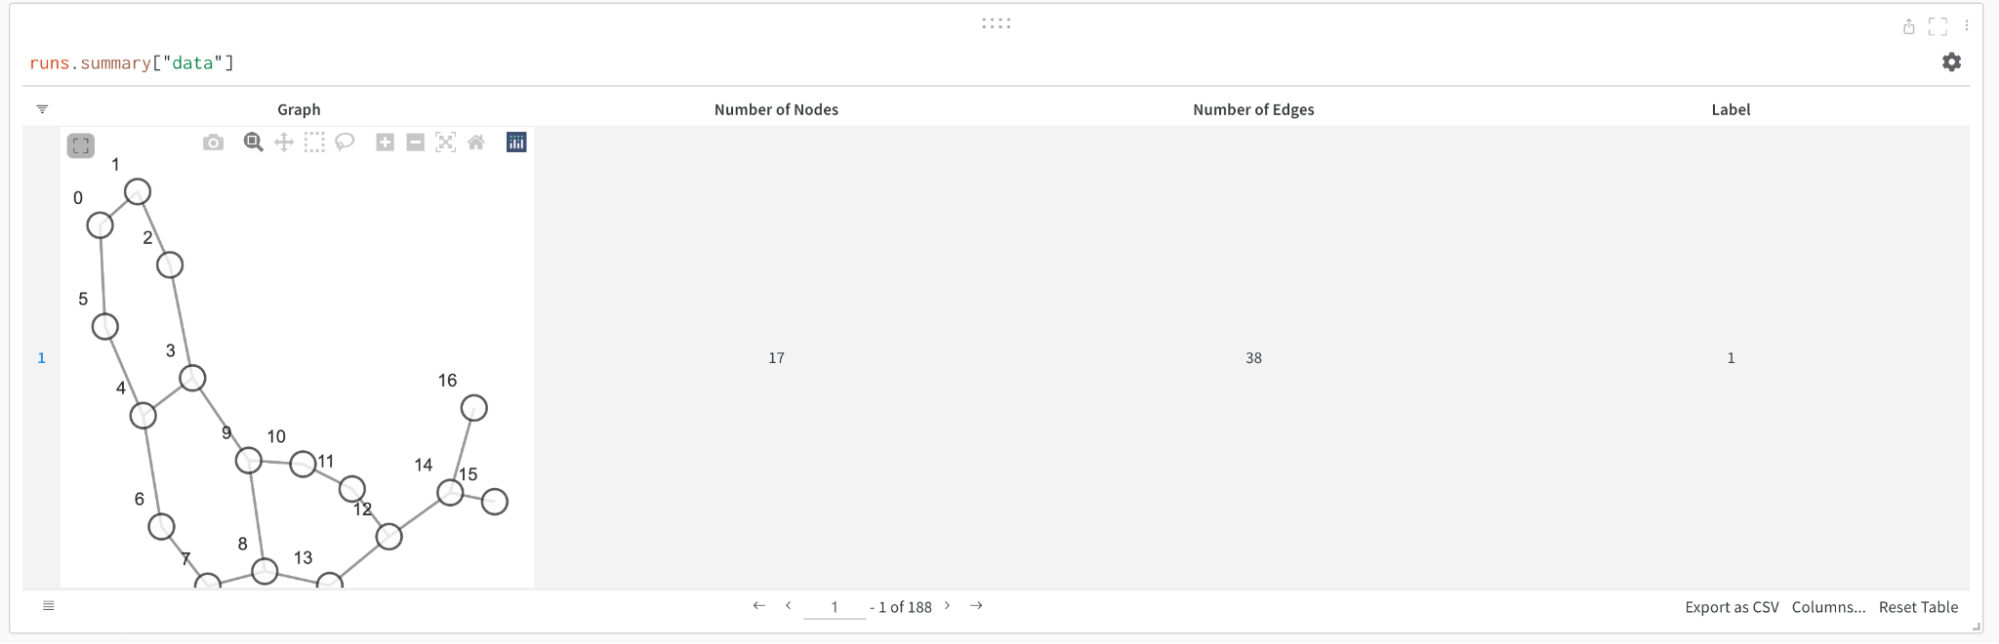
You can save details about the input graphs including number of edges, number of nodes and more. W&B supports logging plotly charts and HTML panels so any visualizations you create for your graph can then also be logged to W&B.
Use PyVis
The following snippet shows how you could do that with PyVis and HTML.
from pyvis.network import Network
import wandb
with wandb.init(project=’graph_vis’) as run:
net = Network(height="750px", width="100%", bgcolor="#222222", font_color="white")
# Add the edges from the PyG graph to the PyVis networkfor e in tqdm(g.edge_index.T):
src = e[0].item()
dst = e[1].item()
net.add_node(dst)
net.add_node(src)
net.add_edge(src, dst, value=0.1)
# Save the PyVis visualisation to a HTML file net.show("graph.html")
run.log({"eda/graph": wandb.Html("graph.html")})
Use Plotly
To use plotly to create a graph visualization, first you need to convert the PyG graph to a networkx object. Following this you will need to create Plotly scatter plots for both nodes and edges. The snippet below can be used for this task.
defcreate_vis(graph):
G = to_networkx(graph)
pos = nx.spring_layout(G)
edge_x = []
edge_y = []
for edge in G.edges():
x0, y0 = pos[edge[0]]
x1, y1 = pos[edge[1]]
edge_x.append(x0)
edge_x.append(x1)
edge_x.append(None)
edge_y.append(y0)
edge_y.append(y1)
edge_y.append(None)
edge_trace = go.Scatter(
x=edge_x, y=edge_y,
line=dict(width=0.5, color='#888'),
hoverinfo='none',
mode='lines' )
node_x = []
node_y = []
for node in G.nodes():
x, y = pos[node]
node_x.append(x)
node_y.append(y)
node_trace = go.Scatter(
x=node_x, y=node_y,
mode='markers',
hoverinfo='text',
line_width=2 )
fig = go.Figure(data=[edge_trace, node_trace], layout=go.Layout())
return fig
with wandb.init(project=’visualize_graph’) as run:
run.log({‘graph’: wandb.Plotly(create_vis(graph))})
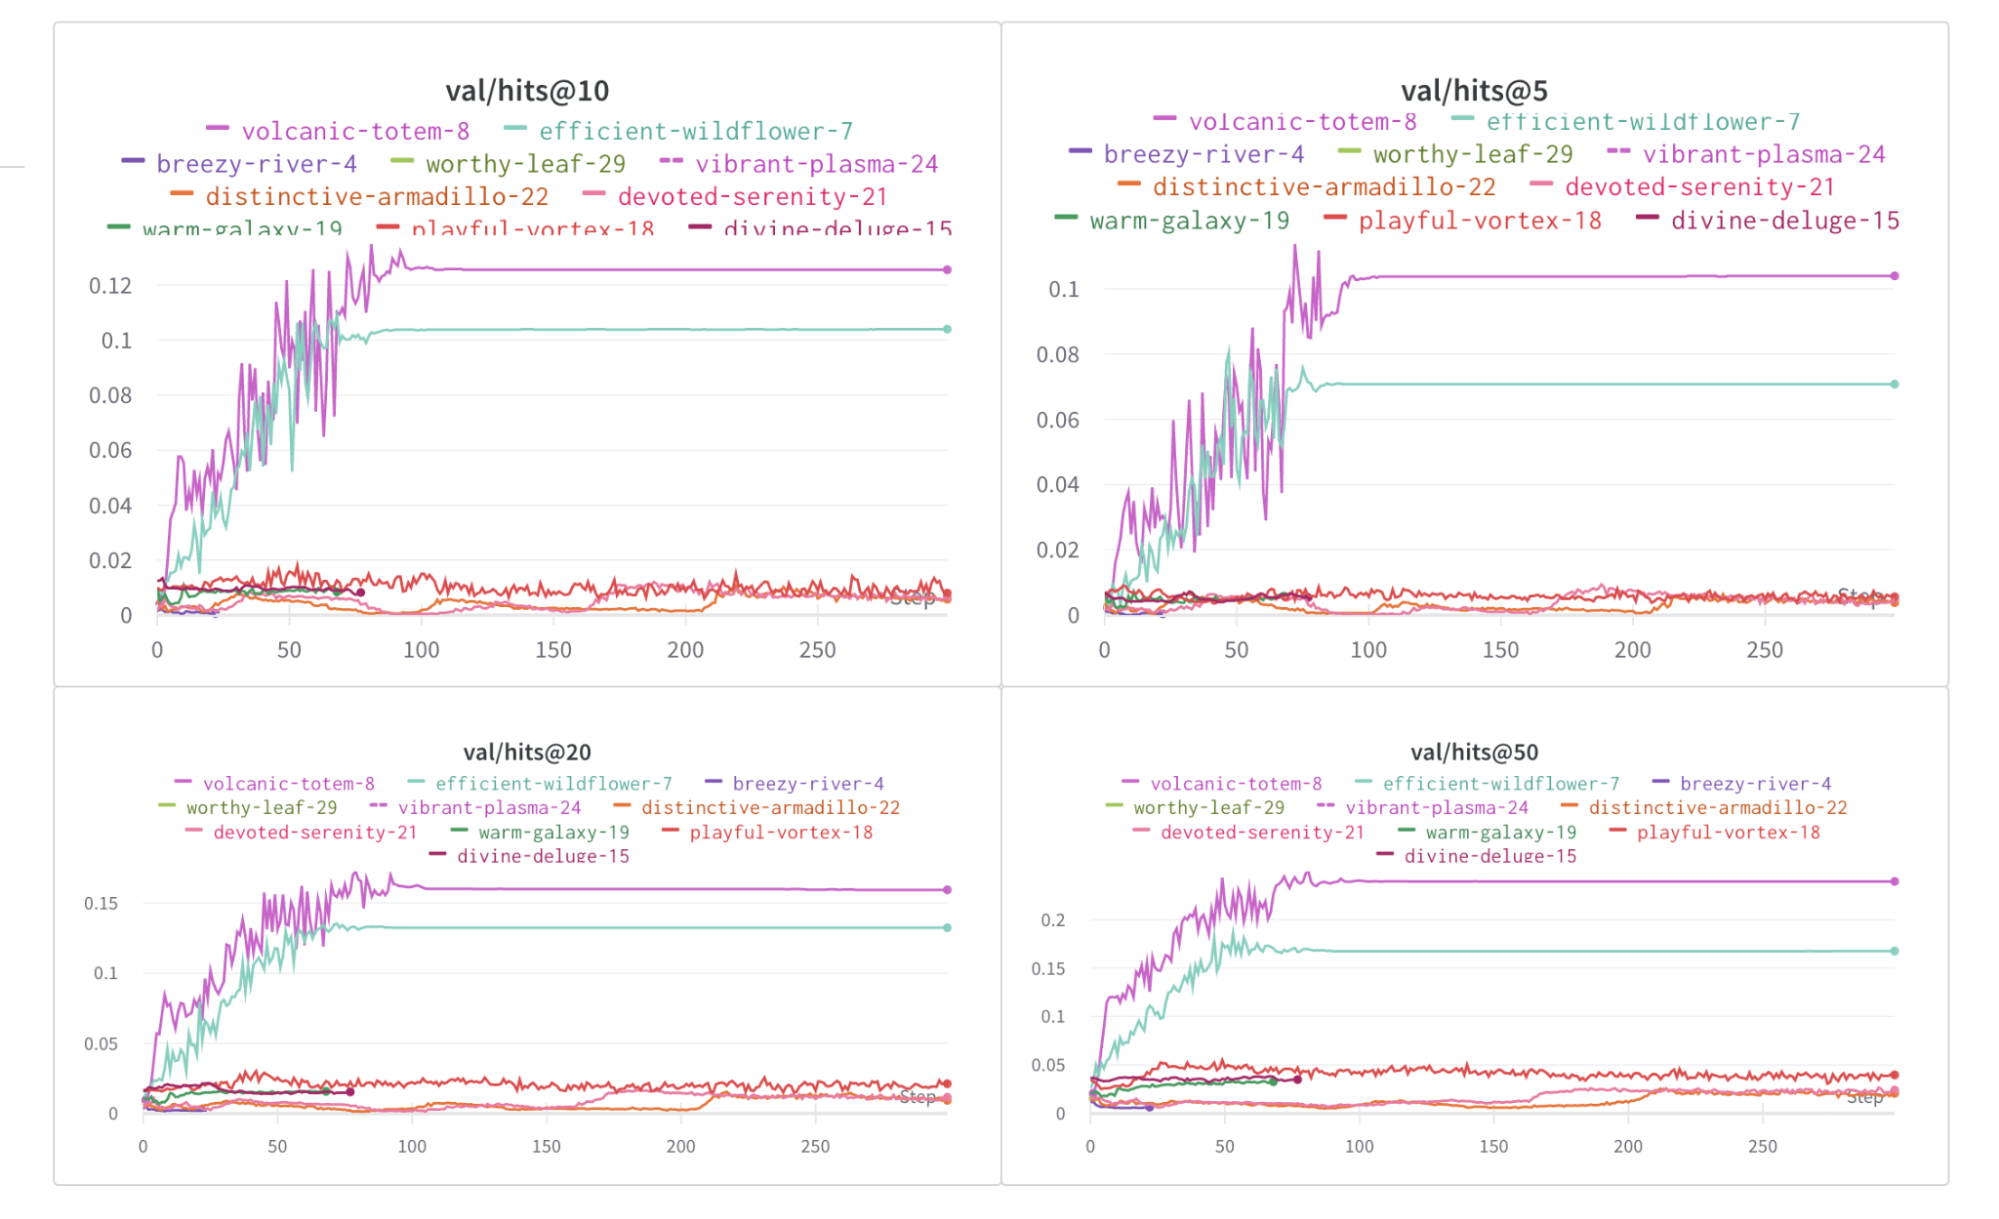
Log metrics
You can use W&B to track your experiments and related metrics, such as loss functions, accuracy, and more. Add the following line to your training loop:
with wandb.init(project="my_project", entity="my_entity") as run:
    run.log({
        'train/loss': training_loss,
        'train/acc': training_acc,
        'val/loss': validation_loss,
        'val/acc': validation_acc
        })
torchtune is a PyTorch-based library designed to streamline the authoring, fine-tuning, and experimentation processes for large language models (LLMs). Additionally, torchtune has built-in support for logging with W&B, enhancing tracking and visualization of training processes.
Enable W&B logging on the recipe’s config file by modifying the metric_logger section. Change the _component_ to torchtune.utils.metric_logging.WandBLogger class. You can also pass a project name and log_every_n_steps to customize the logging behavior.
You can also pass any other kwargs as you would to the wandb.init() method. For example, if you are working on a team, you can pass the entity argument to the WandBLogger class to specify the team name.
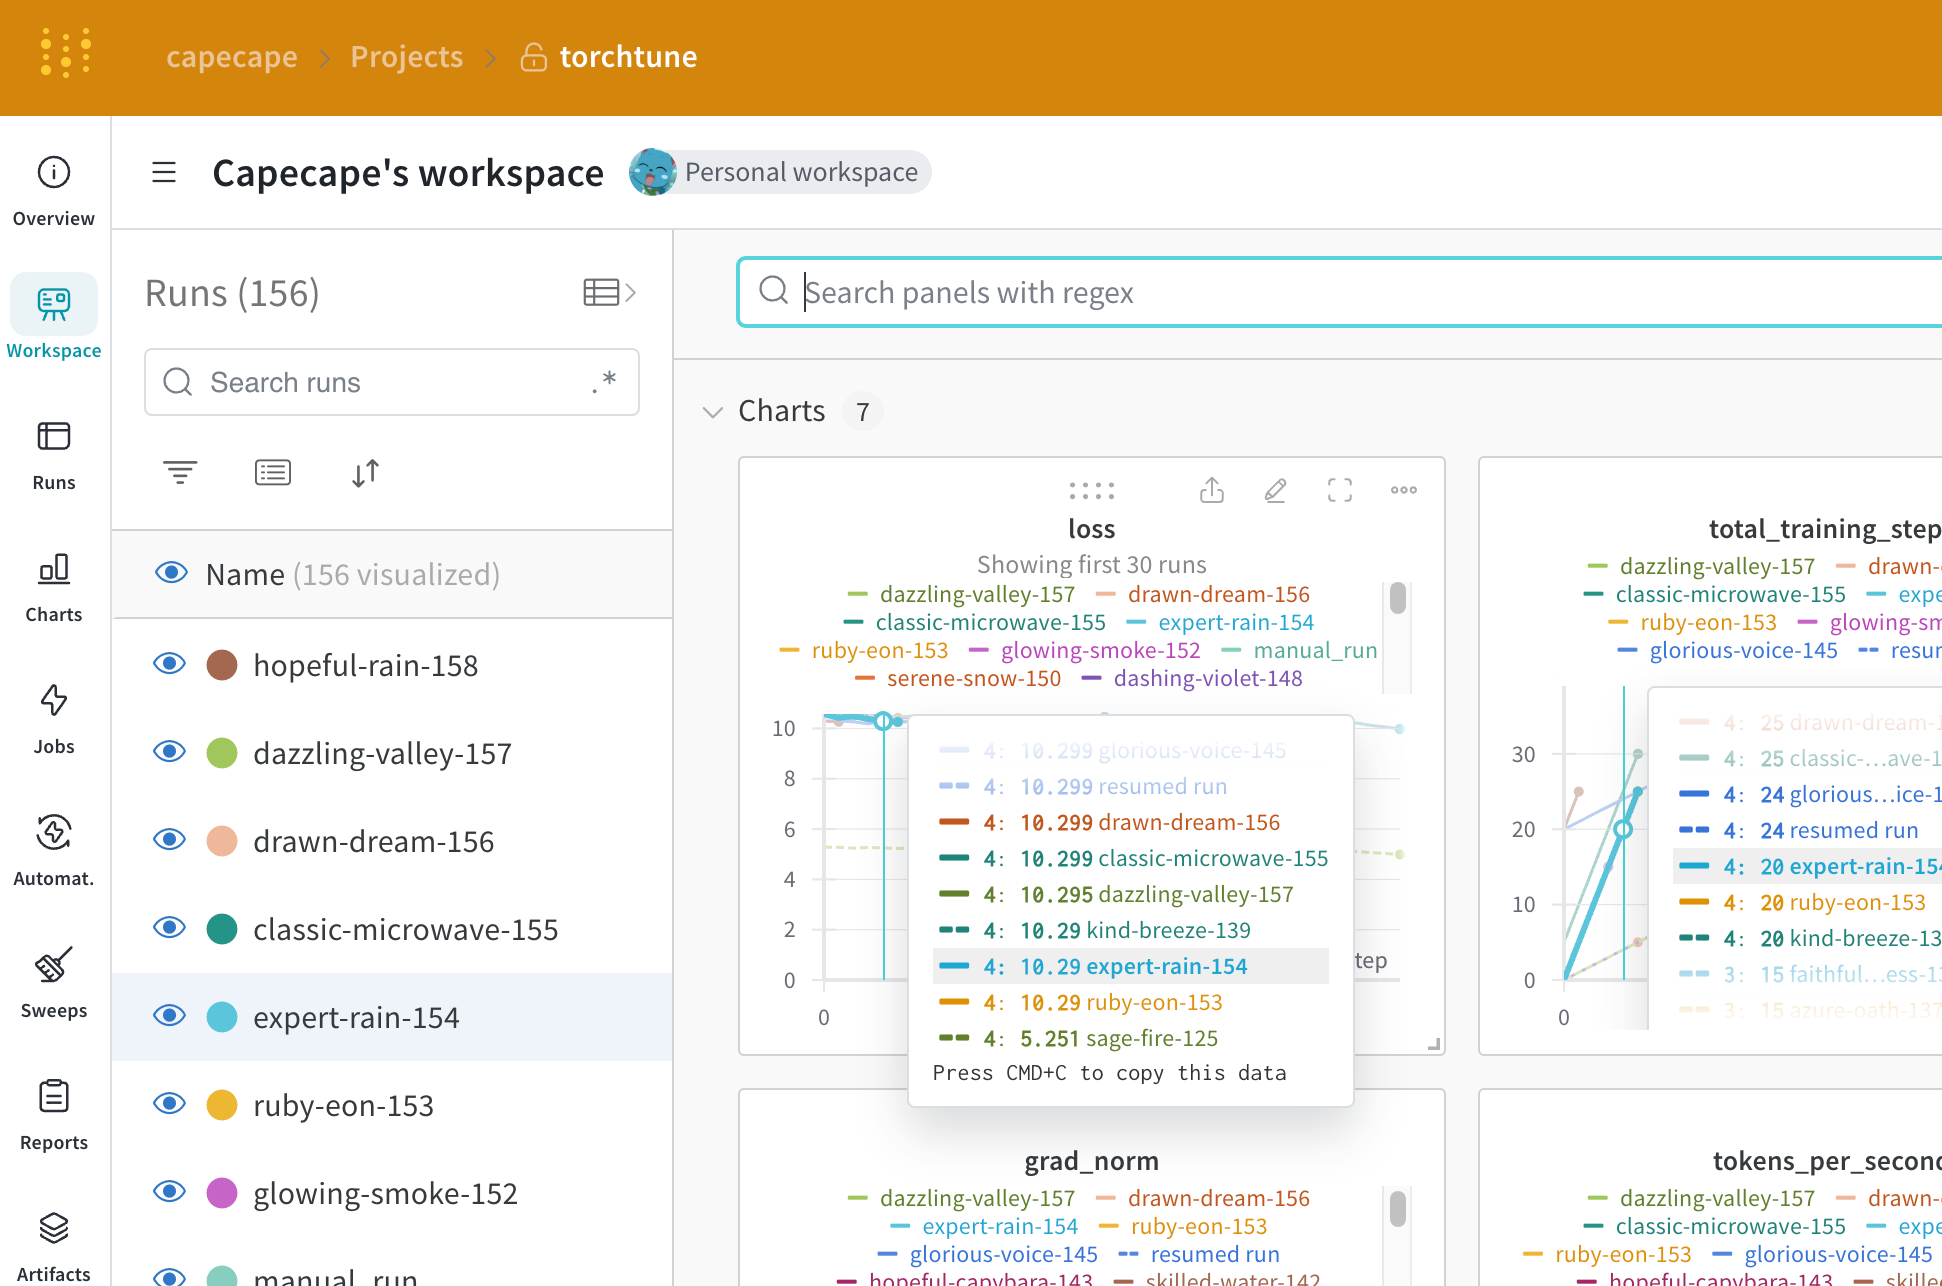
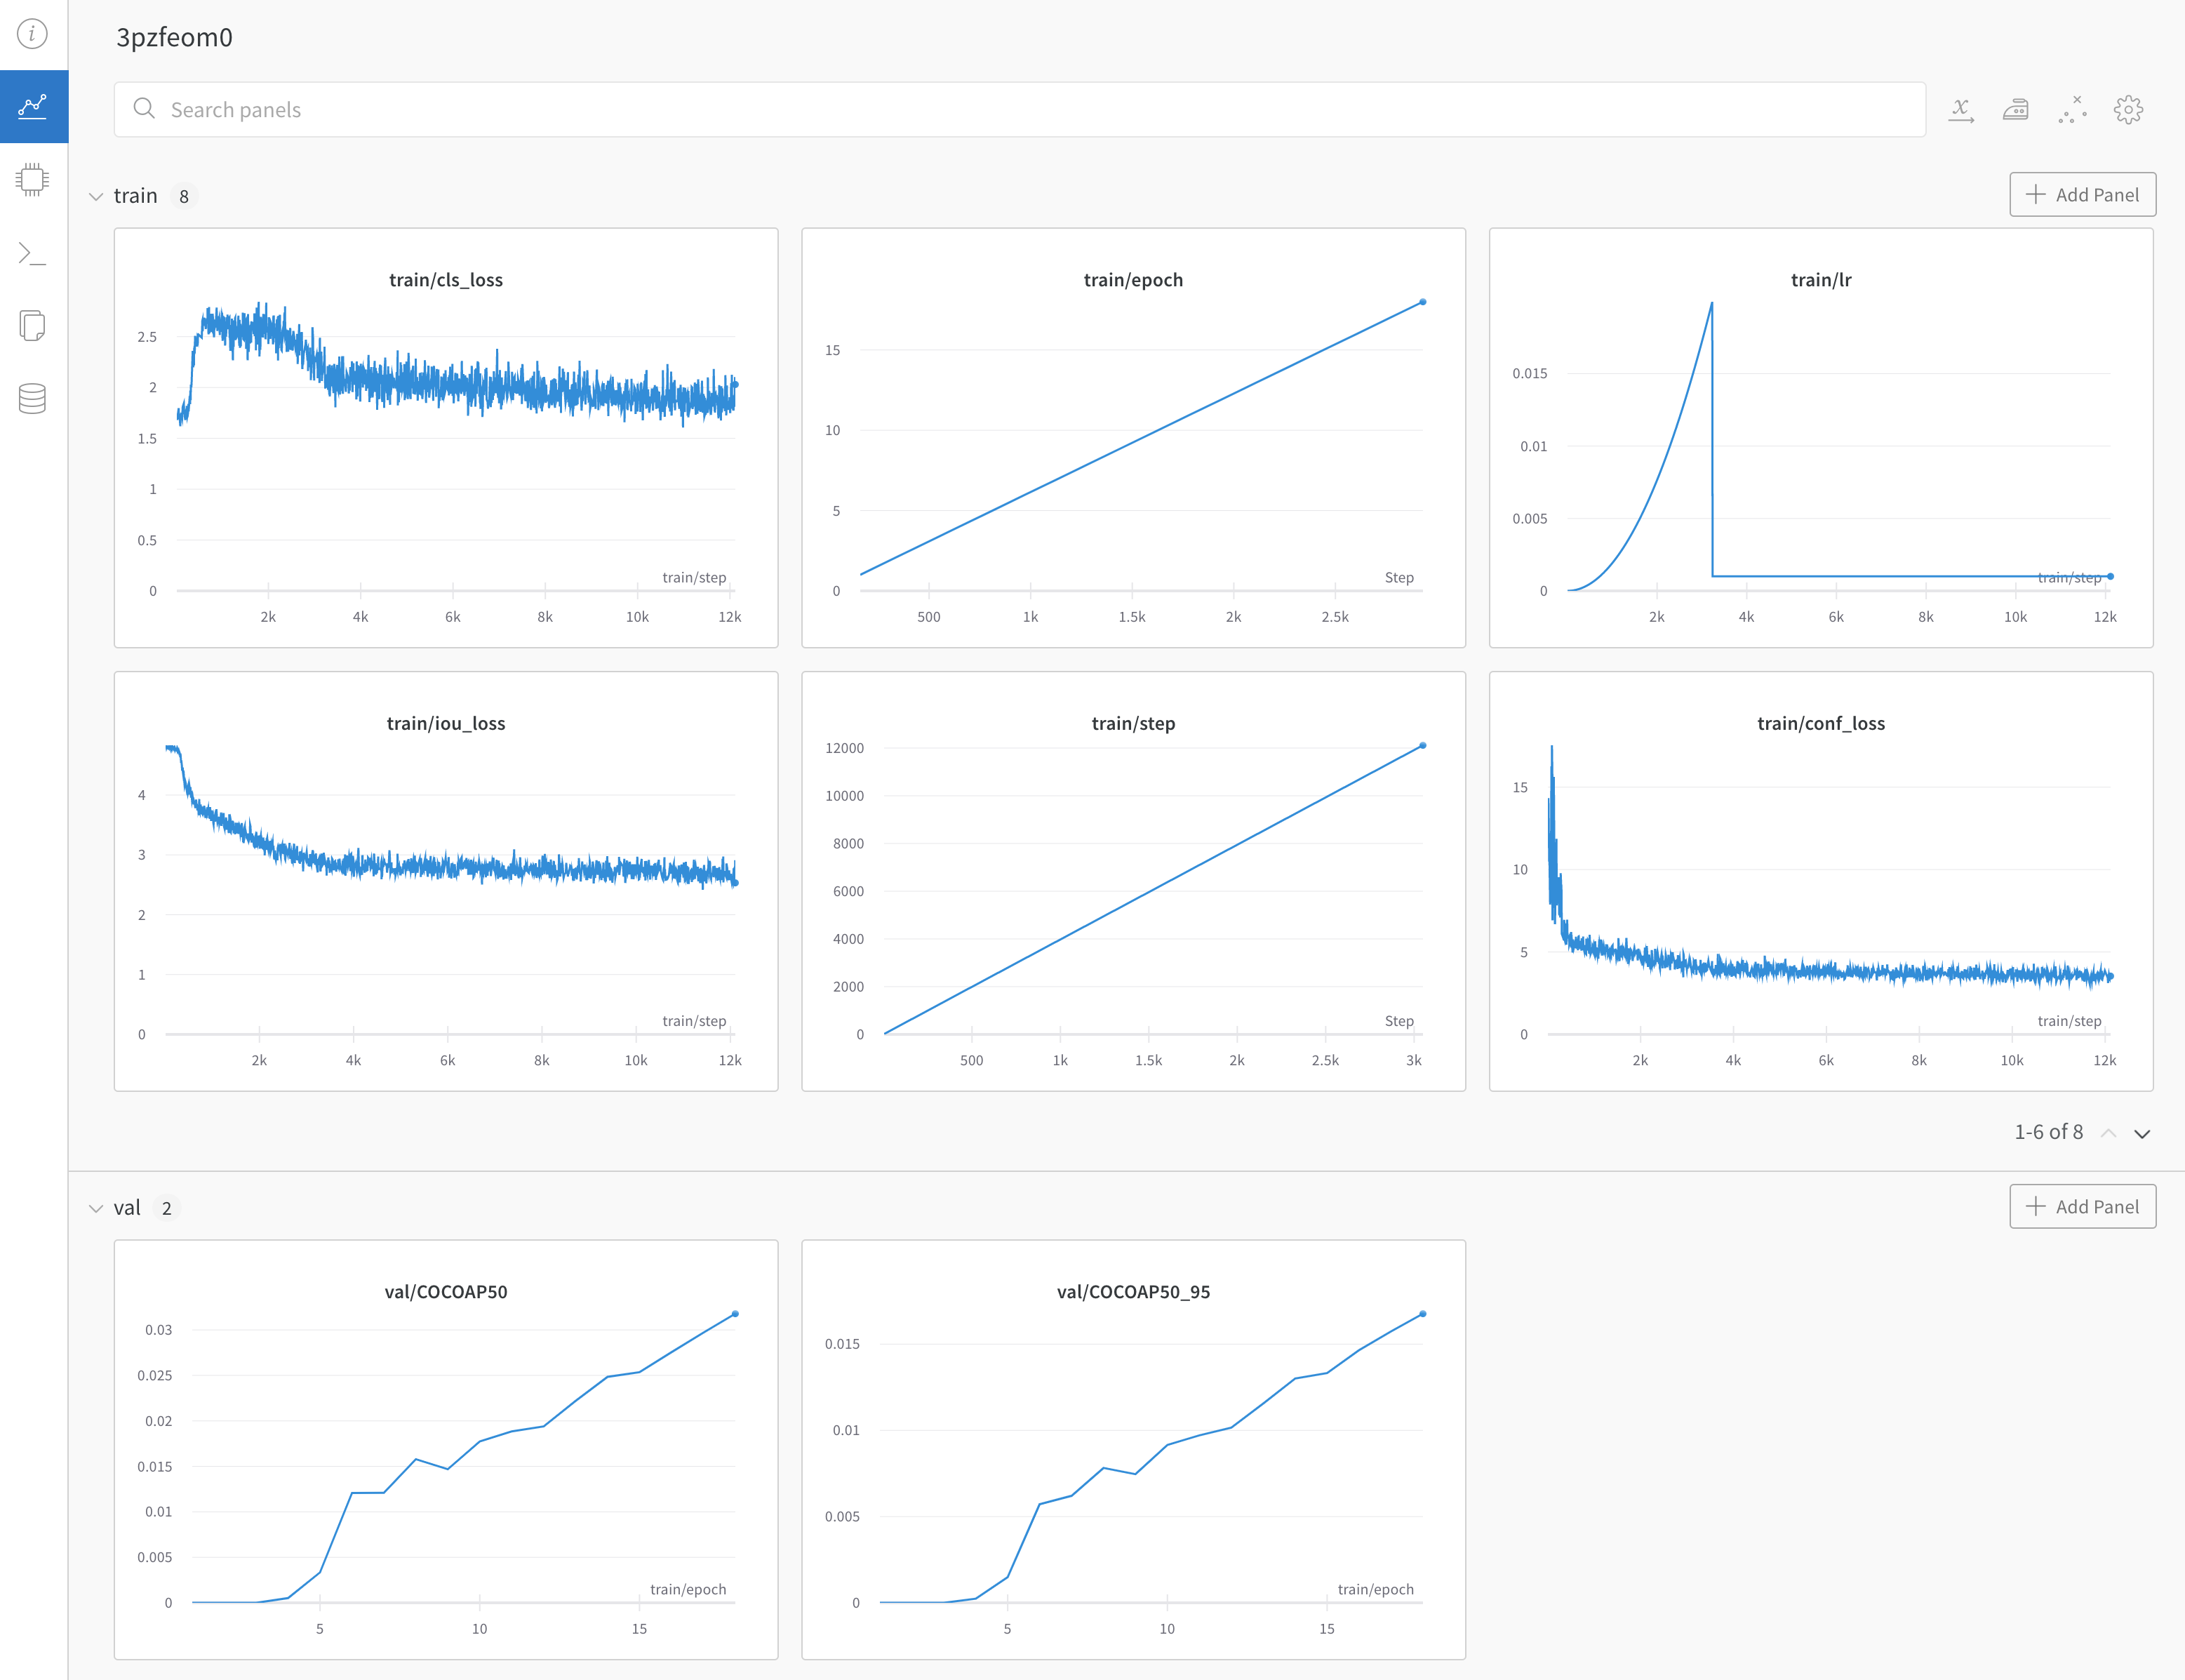
You can explore the W&B dashboard to see the logged metrics. By default W&B logs all of the hyperparameters from the config file and the launch overrides.
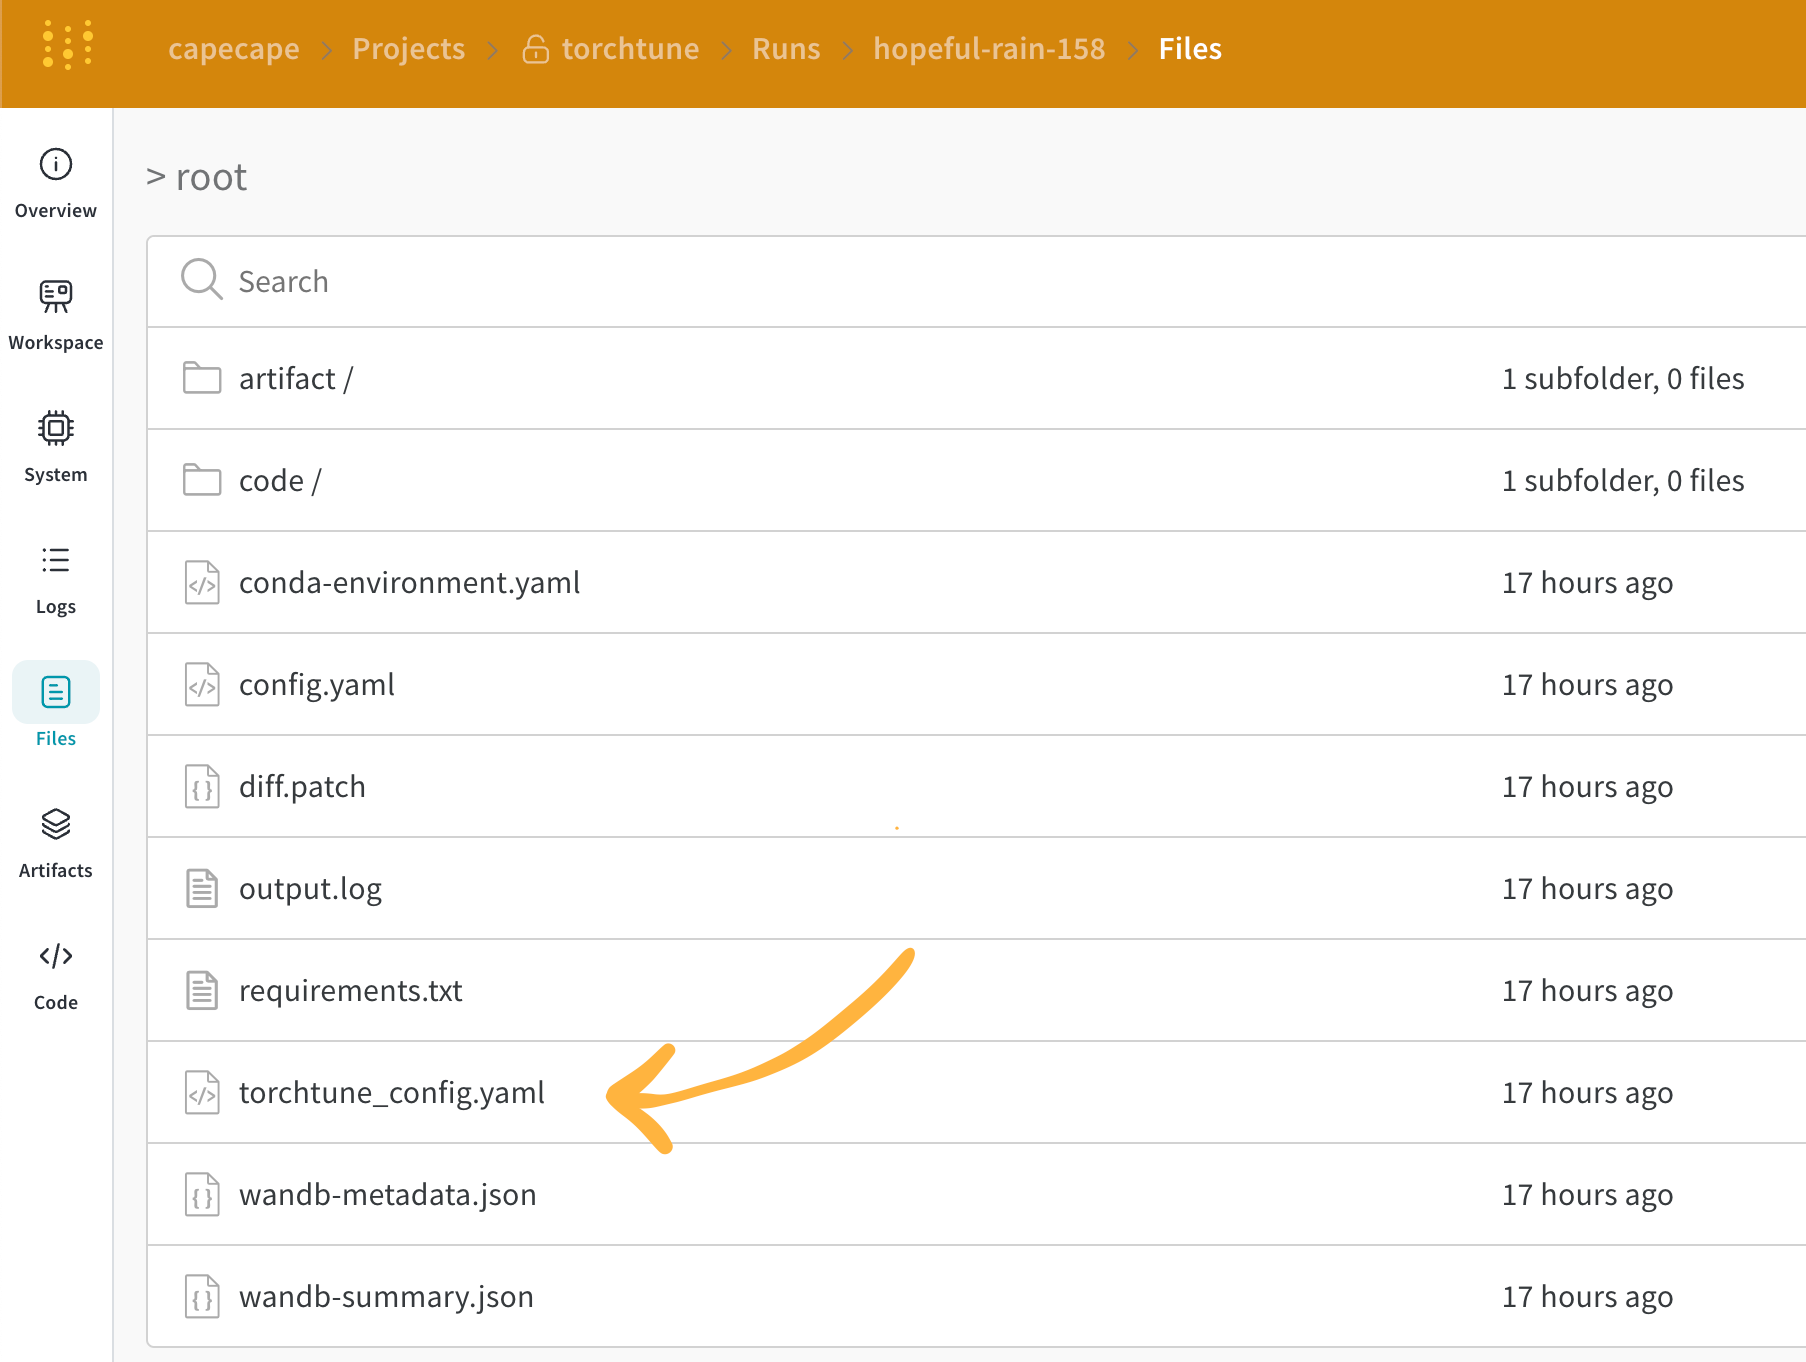
W&B captures the resolved config on the Overview tab. W&B also stores the config in YAML format on the Files tab.
Logged Metrics
Each recipe has its own training loop. Check each individual recipe to see its logged metrics, which include these by default:
Metric
Description
loss
The loss of the model
lr
The learning rate
tokens_per_second
The tokens per second of the model
grad_norm
The gradient norm of the model
global_step
Corresponds to the current step in the training loop. Takes into account gradient accumulation, basically every time an optimizer step is taken, the model is updated, the gradients are accumulated and the model is updated once every gradient_accumulation_steps
global_step is not the same as the number of training steps. It corresponds to the current step in the training loop. Takes into account gradient accumulation, basically every time an optimizer step is taken the global_step is incremented by 1. For example, if the dataloader has 10 batches, gradient accumulation steps is 2 and run for 3 epochs, the optimizer will step 15 times, in this case global_step will range from 1 to 15.
The streamlined design of torchtune allows to easily add custom metrics or modify the existing ones. It suffices to modify the corresponding recipe file, for example, computing one could log current_epoch as a percentage of the total number of epochs as following:
# inside `train.py` function in the recipe fileself._metric_logger.log_dict(
{"current_epoch": self.epochs * self.global_step / self._steps_per_epoch},
step=self.global_step,
)
This is a fast evolving library, the current metrics are subject to change. If you want to add a custom metric, you should modify the recipe and call the corresponding self._metric_logger.* function.
Save and load checkpoints
The torchtune library supports various checkpoint formats. Depending on the origin of the model you are using, you should switch to the appropriate checkpointer class.
If you want to save the model checkpoints to W&B Artifacts, the simplest solution is to override the save_checkpoint functions inside the corresponding recipe.
Here is an example of how you can override the save_checkpoint function to save the model checkpoints to W&B Artifacts.
defsave_checkpoint(self, epoch: int) ->None:
...## Let's save the checkpoint to W&B## depending on the Checkpointer Class the file will be named differently## Here is an example for the full_finetune case checkpoint_file = Path.joinpath(
self._checkpointer._output_dir, f"torchtune_model_{epoch}" ).with_suffix(".pt")
wandb_artifact = wandb.Artifact(
name=f"torchtune_model_{epoch}",
type="model",
# description of the model checkpoint description="Model checkpoint",
# you can add whatever metadata you want as a dict metadata={
utils.SEED_KEY: self.seed,
utils.EPOCHS_KEY: self.epochs_run,
utils.TOTAL_EPOCHS_KEY: self.total_epochs,
utils.MAX_STEPS_KEY: self.max_steps_per_epoch,
},
)
wandb_artifact.add_file(checkpoint_file)
wandb.log_artifact(wandb_artifact)
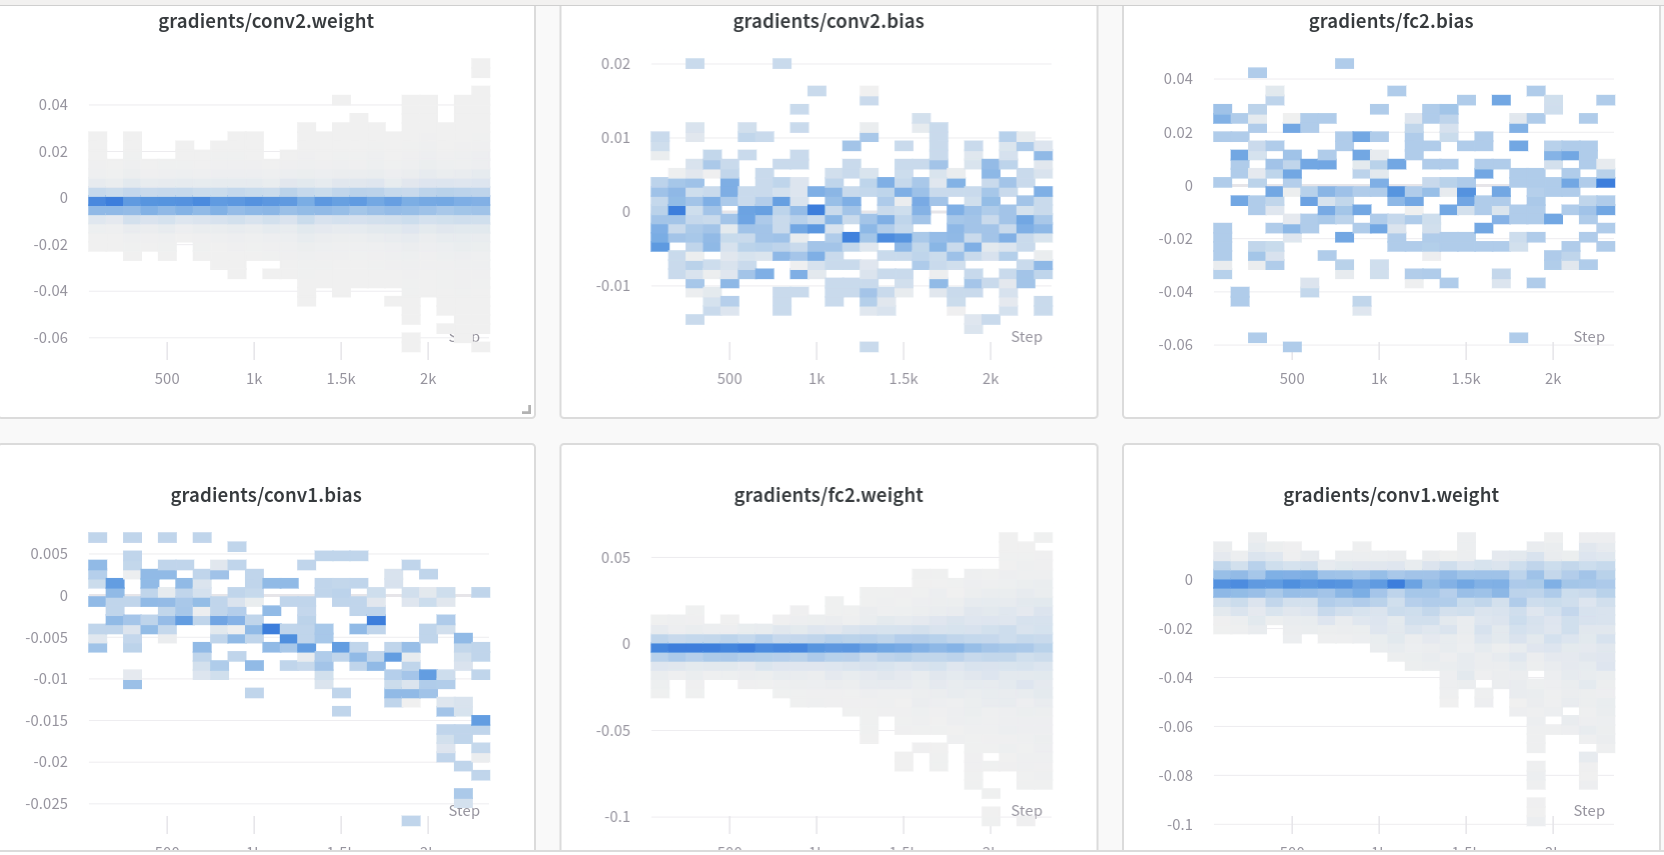
Ignite supports W&B handler to log metrics, model/optimizer parameters, gradients during training and validation. It can also be used to log model checkpoints to the W&B cloud. This class is also a wrapper for the wandb module. This means that you can call any wandb function using this wrapper. See examples on how to save model parameters and gradients.
Basic setup
from argparse import ArgumentParser
import wandb
import torch
from torch import nn
from torch.optim import SGD
from torch.utils.data import DataLoader
import torch.nn.functional as F
from torchvision.transforms import Compose, ToTensor, Normalize
from torchvision.datasets import MNIST
from ignite.engine import Events, create_supervised_trainer, create_supervised_evaluator
from ignite.metrics import Accuracy, Loss
from tqdm import tqdm
classNet(nn.Module):
def__init__(self):
super(Net, self).__init__()
self.conv1 = nn.Conv2d(1, 10, kernel_size=5)
self.conv2 = nn.Conv2d(10, 20, kernel_size=5)
self.conv2_drop = nn.Dropout2d()
self.fc1 = nn.Linear(320, 50)
self.fc2 = nn.Linear(50, 10)
defforward(self, x):
x = F.relu(F.max_pool2d(self.conv1(x), 2))
x = F.relu(F.max_pool2d(self.conv2_drop(self.conv2(x)), 2))
x = x.view(-1, 320)
x = F.relu(self.fc1(x))
x = F.dropout(x, training=self.training)
x = self.fc2(x)
return F.log_softmax(x, dim=-1)
defget_data_loaders(train_batch_size, val_batch_size):
data_transform = Compose([ToTensor(), Normalize((0.1307,), (0.3081,))])
train_loader = DataLoader(MNIST(download=True, root=".", transform=data_transform, train=True),
batch_size=train_batch_size, shuffle=True)
val_loader = DataLoader(MNIST(download=False, root=".", transform=data_transform, train=False),
batch_size=val_batch_size, shuffle=False)
return train_loader, val_loader
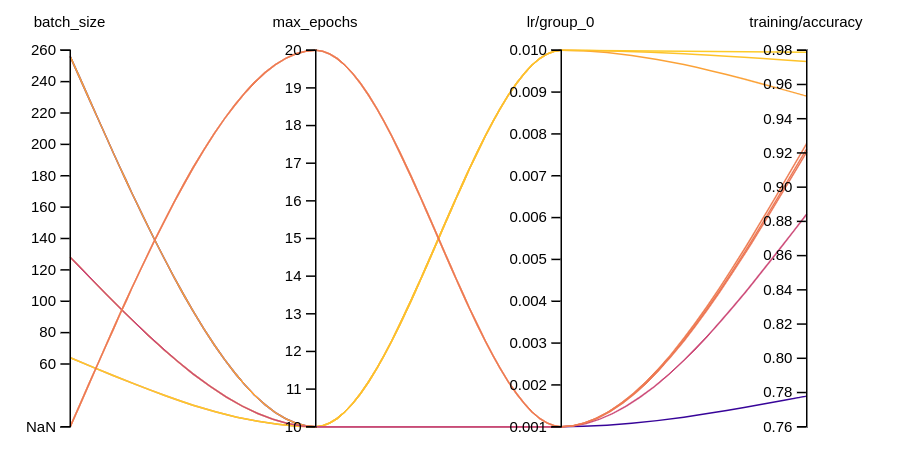
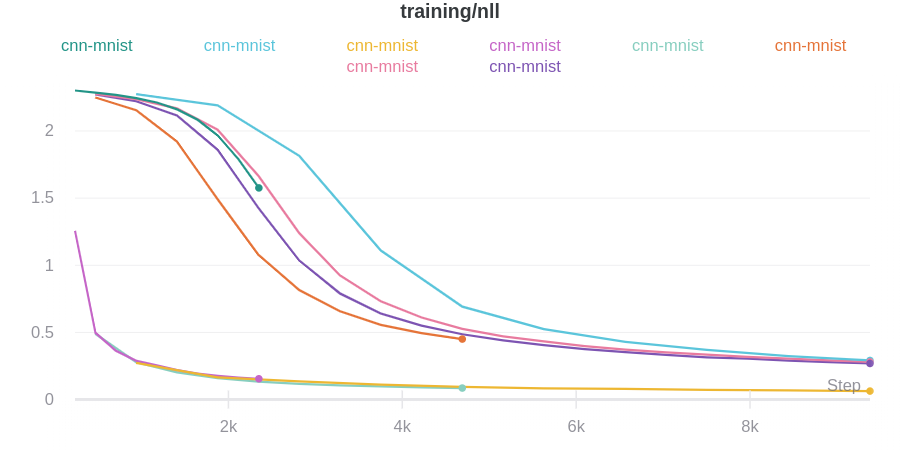
Using WandBLogger in ignite is a modular process. First, you create a WandBLogger object. Next, you attach it to a trainer or evaluator to automatically log the metrics. This example shows:
Logs training loss, attached to the trainer object.
PyTorch Lightning provides a lightweight wrapper for organizing your PyTorch code and easily adding advanced features such as distributed training and 16-bit precision. W&B provides a lightweight wrapper for logging your ML experiments. But you don’t need to combine the two yourself: W&B is incorporated directly into the PyTorch Lightning library via the WandbLogger.
Integrate with Lightning
from lightning.pytorch.loggers import WandbLogger
from lightning.pytorch import Trainer

wandb_logger = WandbLogger(log_model="all")
trainer = Trainer(logger=wandb_logger)
Using wandb.log(): The WandbLogger logs to W&B using the Trainer’s global_step. If you make additional calls to wandb.log directly in your code, do not use the step argument in wandb.log().
Instead, log the Trainer’s global_step like your other metrics:
import lightning as L
from wandb.integration.lightning.fabric import WandbLogger

wandb_logger = WandbLogger(log_model="all")
fabric = L.Fabric(loggers=[wandb_logger])
fabric.launch()
fabric.log_dict({"important_metric": important_metric})
Sign up and create an API key
An API key authenticates your machine to W&B. You can generate an API key from your user profile.
For a more streamlined approach, you can generate an API key by going directly to the W&B authorization page. Copy the displayed API key and save it in a secure location such as a password manager.
Click your user profile icon in the upper right corner.
Select User Settings, then scroll to the API Keys section.
Click Reveal. Copy the displayed API key. To hide the API key, reload the page.
# add one parameterwandb_logger.experiment.config["key"] = value
# add multiple parameterswandb_logger.experiment.config.update({key1: val1, key2: val2})
# use directly wandb modulewandb.config["key"] = value
wandb.config.update()
Log gradients, parameter histogram and model topology
You can pass your model object to wandblogger.watch() to monitor your models’s gradients and parameters as you train. See the PyTorch Lightning WandbLogger documentation
Log metrics
You can log your metrics to W&B when using the WandbLogger by calling self.log('my_metric_name', metric_vale) within your LightningModule, such as in your training_step or validation_step methods.
The code snippet below shows how to define your LightningModule to log your metrics and your LightningModule hyperparameters. This example uses the torchmetrics library to calculate your metrics
import torch
from torch.nn import Linear, CrossEntropyLoss, functional as F
from torch.optim import Adam
from torchmetrics.functional import accuracy
from lightning.pytorch import LightningModule
classMy_LitModule(LightningModule):
def__init__(self, n_classes=10, n_layer_1=128, n_layer_2=256, lr=1e-3):
"""method used to define the model parameters""" super().__init__()
# mnist images are (1, 28, 28) (channels, width, height) self.layer_1 = Linear(28*28, n_layer_1)
self.layer_2 = Linear(n_layer_1, n_layer_2)
self.layer_3 = Linear(n_layer_2, n_classes)
self.loss = CrossEntropyLoss()
self.lr = lr
# save hyper-parameters to self.hparams (auto-logged by W&B) self.save_hyperparameters()
defforward(self, x):
"""method used for inference input -> output"""# (b, 1, 28, 28) -> (b, 1*28*28) batch_size, channels, width, height = x.size()
x = x.view(batch_size, -1)
# let's do 3 x (linear + relu) x = F.relu(self.layer_1(x))
x = F.relu(self.layer_2(x))
x = self.layer_3(x)
return x
deftraining_step(self, batch, batch_idx):
"""needs to return a loss from a single batch""" _, loss, acc = self._get_preds_loss_accuracy(batch)
# Log loss and metric self.log("train_loss", loss)
self.log("train_accuracy", acc)
return loss
defvalidation_step(self, batch, batch_idx):
"""used for logging metrics""" preds, loss, acc = self._get_preds_loss_accuracy(batch)
# Log loss and metric self.log("val_loss", loss)
self.log("val_accuracy", acc)
return preds
defconfigure_optimizers(self):
"""defines model optimizer"""return Adam(self.parameters(), lr=self.lr)
def_get_preds_loss_accuracy(self, batch):
"""convenience function since train/valid/test steps are similar""" x, y = batch
logits = self(x)
preds = torch.argmax(logits, dim=1)
loss = self.loss(logits, y)
acc = accuracy(preds, y)
return preds, loss, acc
import lightning as L
import torch
import torchvision as tv
from wandb.integration.lightning.fabric import WandbLogger
import wandb

fabric = L.Fabric(loggers=[wandb_logger])
fabric.launch()

model = tv.models.resnet18()
optimizer = torch.optim.SGD(model.parameters(), lr=lr)
model, optimizer = fabric.setup(model, optimizer)

train_dataloader = fabric.setup_dataloaders(
    torch.utils.data.DataLoader(train_dataset, batch_size=batch_size)
)

model.train()
for epoch in range(num_epochs):
    for batch in train_dataloader:
        optimizer.zero_grad()
        loss = model(batch)
        loss.backward()
        optimizer.step()
        fabric.log_dict({"loss": loss})
Log the min/max of a metric
Using wandb’s define_metric function you can define whether you’d like your W&B summary metric to display the min, max, mean or best value for that metric. If define_metric _ isn’t used, then the last value logged with appear in your summary metrics. See the define_metricreference docs here and the guide here for more.
To tell W&B to keep track of the max validation accuracy in the W&B summary metric, call wandb.define_metric only once, at the beginning of training:
classMy_LitModule(LightningModule):
...defvalidation_step(self, batch, batch_idx):
if trainer.global_step ==0:
wandb.define_metric("val_accuracy", summary="max")
preds, loss, acc = self._get_preds_loss_accuracy(batch)
# Log loss and metric self.log("val_loss", loss)
self.log("val_accuracy", acc)
return preds
The latest and best aliases are automatically set to easily retrieve a model checkpoint from a W&B Artifact:
# reference can be retrieved in artifacts panel# "VERSION" can be a version (ex: "v2") or an alias ("latest or "best")checkpoint_reference ="USER/PROJECT/MODEL-RUN_ID:VERSION"
# download checkpoint locally (if not already cached)wandb_logger.download_artifact(checkpoint_reference, artifact_type="model")
# Request the raw checkpointfull_checkpoint = fabric.load(Path(artifact_dir) /"model.ckpt")
model.load_state_dict(full_checkpoint["model"])
optimizer.load_state_dict(full_checkpoint["optimizer"])
The model checkpoints you log are viewable through the W&B Artifacts UI, and include the full model lineage (see an example model checkpoint in the UI here).
To bookmark your best model checkpoints and centralize them across your team, you can link them to the W&B Model Registry.
Here you can organize your best models by task, manage model lifecycle, facilitate easy tracking and auditing throughout the ML lifecyle, and automate downstream actions with webhooks or jobs.
Log images, text, and more
The WandbLogger has log_image, log_text and log_table methods for logging media.
You can also directly call wandb.log or trainer.logger.experiment.log to log other media types such as Audio, Molecules, Point Clouds, 3D Objects and more.
# using tensors, numpy arrays or PIL imageswandb_logger.log_image(key="samples", images=[img1, img2])
# adding captionswandb_logger.log_image(key="samples", images=[img1, img2], caption=["tree", "person"])
# using file pathwandb_logger.log_image(key="samples", images=["img_1.jpg", "img_2.jpg"])
# using .log in the trainertrainer.logger.experiment.log(
{"samples": [wandb.Image(img, caption=caption) for (img, caption) in my_images]},
step=current_trainer_global_step,
)
# data should be a list of listscolumns = ["input", "label", "prediction"]
my_data = [["cheese", "english", "english"], ["fromage", "french", "spanish"]]
# using columns and datawandb_logger.log_text(key="my_samples", columns=columns, data=my_data)
# using a pandas DataFramewandb_logger.log_text(key="my_samples", dataframe=my_dataframe)
# log a W&B Table that has a text caption, an image and audiocolumns = ["caption", "image", "sound"]
# data should be a list of listsmy_data = [
["cheese", wandb.Image(img_1), wandb.Audio(snd_1)],
["wine", wandb.Image(img_2), wandb.Audio(snd_2)],
]
# log the Tablewandb_logger.log_table(key="my_samples", columns=columns, data=data)
You can use Lightning’s Callbacks system to control when you log to W&B via the WandbLogger, in this example we log a sample of our validation images and predictions:
import torch
import wandb
import lightning.pytorch as pl
from lightning.pytorch.loggers import WandbLogger
# or# from wandb.integration.lightning.fabric import WandbLoggerclassLogPredictionSamplesCallback(Callback):
defon_validation_batch_end(
self, trainer, pl_module, outputs, batch, batch_idx, dataloader_idx
):
"""Called when the validation batch ends."""# `outputs` comes from `LightningModule.validation_step`# which corresponds to our model predictions in this case# Let's log 20 sample image predictions from the first batchif batch_idx ==0:
n =20 x, y = batch
images = [img for img in x[:n]]
captions = [
f"Ground Truth: {y_i} - Prediction: {y_pred}"for y_i, y_pred in zip(y[:n], outputs[:n])
]
# Option 1: log images with `WandbLogger.log_image` wandb_logger.log_image(key="sample_images", images=images, caption=captions)
# Option 2: log images and predictions as a W&B Table columns = ["image", "ground truth", "prediction"]
data = [
[wandb.Image(x_i), y_i, y_pred] or x_i,
y_i,
y_pred in list(zip(x[:n], y[:n], outputs[:n])),
]
wandb_logger.log_table(key="sample_table", columns=columns, data=data)
trainer = pl.Trainer(callbacks=[LogPredictionSamplesCallback()])
Use multiple GPUs with Lightning and W&B
PyTorch Lightning has Multi-GPU support through their DDP Interface. However, PyTorch Lightning’s design requires you to be careful about how you instantiate our GPUs.
Lightning assumes that each GPU (or Rank) in your training loop must be instantiated in exactly the same way - with the same initial conditions. However, only rank 0 process gets access to the wandb.run object, and for non-zero rank processes: wandb.run = None. This could cause your non-zero processes to fail. Such a situation can put you in a deadlock because rank 0 process will wait for the non-zero rank processes to join, which have already crashed.
For this reason, be careful about how we set up your training code. The recommended way to set it up would be to have your code be independent of the wandb.run object.
classMNISTClassifier(pl.LightningModule):
def__init__(self):
super(MNISTClassifier, self).__init__()
self.model = nn.Sequential(
nn.Flatten(),
nn.Linear(28*28, 128),
nn.ReLU(),
nn.Linear(128, 10),
)
self.loss = nn.CrossEntropyLoss()
defforward(self, x):
return self.model(x)
deftraining_step(self, batch, batch_idx):
x, y = batch
y_hat = self.forward(x)
loss = self.loss(y_hat, y)
self.log("train/loss", loss)
return {"train_loss": loss}
defvalidation_step(self, batch, batch_idx):
x, y = batch
y_hat = self.forward(x)
loss = self.loss(y_hat, y)
self.log("val/loss", loss)
return {"val_loss": loss}
defconfigure_optimizers(self):
return torch.optim.Adam(self.parameters(), lr=0.001)
defmain():
# Setting all the random seeds to the same value.# This is important in a distributed training setting.# Each rank will get its own set of initial weights.# If they don't match up, the gradients will not match either,# leading to training that may not converge. pl.seed_everything(1)
train_loader = DataLoader(train_dataset, batch_size=64, shuffle=True, num_workers=4)
val_loader = DataLoader(val_dataset, batch_size=64, shuffle=False, num_workers=4)
model = MNISTClassifier()
wandb_logger = WandbLogger(project="<project_name>")
callbacks = [
ModelCheckpoint(
dirpath="checkpoints",
every_n_train_steps=100,
),
]
trainer = pl.Trainer(
max_epochs=3, gpus=2, logger=wandb_logger, strategy="ddp", callbacks=callbacks
)
trainer.fit(model, train_loader, val_loader)
The core integration is based on the Lightning loggers API, which lets you write much of your logging code in a framework-agnostic way. Loggers are passed to the Lightning Trainer and are triggered based on that API’s rich hook-and-callback system. This keeps your research code well-separated from engineering and logging code.
What does the integration log without any additional code?
We’ll save your model checkpoints to W&B, where you can view them or download them for use in future runs. We’ll also capture system metrics, like GPU usage and network I/O, environment information, like hardware and OS information, code state (including git commit and diff patch, notebook contents and session history), and anything printed to the standard out.
What if I need to use wandb.run in my training setup?
You need to expand the scope of the variable you need to access yourself. In other words, make sure that the initial conditions are the same on all processes.
if os.environ.get("LOCAL_RANK", None) isNone:
os.environ["WANDB_DIR"] = wandb.run.dir
If they are, you can use os.environ["WANDB_DIR"] to set up the model checkpoints directory. This way, any non-zero rank process can access wandb.run.dir.
14 - Ray Tune
How to integrate W&B with Ray Tune.
W&B integrates with Ray by offering two lightweight integrations.
TheWandbLoggerCallback function automatically logs metrics reported to Tune to the Wandb API.
The setup_wandb() function, which can be used with the function API, automatically initializes the Wandb API with Tune’s training information. You can use the Wandb API as usual. such as by using run.log() to log your training process.
Configure the integration
from ray.air.integrations.wandb import WandbLoggerCallback
Wandb configuration is done by passing a wandb key to the config parameter of tune.run() (see example below).
The content of the wandb config entry is passed to wandb.init() as keyword arguments. The exception are the following settings, which are used to configure the WandbLoggerCallback itself:
Parameters
project (str): Name of the Wandb project. Mandatory.
api_key_file (str): Path to file containing the Wandb API KEY.
api_key (str): Wandb API Key. Alternative to setting api_key_file.
excludes (list): List of metrics to exclude from the log.
log_config (bool): Whether to log the config parameter of the results dictionary. Defaults to False.
upload_checkpoints (bool): If True, model checkpoints are uploaded as artifacts. Defaults to False.
Example
from ray import tune, train
from ray.air.integrations.wandb import WandbLoggerCallback
deftrain_fc(config):
for i in range(10):
train.report({"mean_accuracy": (i + config["alpha"]) /10})
tuner = tune.Tuner(
train_fc,
param_space={
"alpha": tune.grid_search([0.1, 0.2, 0.3]),
"beta": tune.uniform(0.5, 1.0),
},
run_config=train.RunConfig(
callbacks=[
WandbLoggerCallback(
project="<your-project>", api_key="<your-api-key>", log_config=True )
]
),
)
results = tuner.fit()
setup_wandb
from ray.air.integrations.wandb import setup_wandb
This utility function helps initialize Wandb for use with Ray Tune. For basic usage, call setup_wandb() in your training function:
from ray.air.integrations.wandb import setup_wandb
deftrain_fn(config):
# Initialize wandb wandb = setup_wandb(config)
run = wandb.init(
project=config["wandb"]["project"],
api_key_file=config["wandb"]["api_key_file"],
)
for i in range(10):
loss = config["a"] + config["b"]
run.log({"loss": loss})
tune.report(loss=loss)
run.finish()
tuner = tune.Tuner(
train_fn,
param_space={
# define search space here"a": tune.choice([1, 2, 3]),
"b": tune.choice([4, 5, 6]),
# wandb configuration"wandb": {"project": "Optimization_Project", "api_key_file": "/path/to/file"},
},
)
results = tuner.fit()
Example Code
We’ve created a few examples for you to see how the integration works:
Dashboard: View dashboard generated from the example.
15 - SageMaker
How to integrate W&B with Amazon SageMaker.
W&B integrates with Amazon SageMaker, automatically reading hyperparameters, grouping distributed runs, and resuming runs from checkpoints.
Authentication
W&B looks for a file named secrets.env relative to the training script and loads them into the environment when wandb.init() is called. You can generate a secrets.env file by calling wandb.sagemaker_auth(path="source_dir") in the script you use to launch your experiments. Be sure to add this file to your .gitignore!
Existing estimators
If you’re using one of SageMakers preconfigured estimators you need to add a requirements.txt to your source directory that includes wandb
wandb
If you’re using an estimator that’s running Python 2, you’ll need to install psutil directly from this wheel before installing wandb:
The W&B sweep agent behaves as expected in a SageMaker job only if your SageMaker integration is turned off. Turn off the SageMaker integration by modifying your invocation of wandb.init:
You can use wandb to visualize and compare your scikit-learn models’ performance with just a few lines of code. Try an example →
Get started
Sign up and create an API key
An API key authenticates your machine to W&B. You can generate an API key from your user profile.
For a more streamlined approach, you can generate an API key by going directly to the W&B authorization page. Copy the displayed API key and save it in a secure location such as a password manager.
Click your user profile icon in the upper right corner.
Select User Settings, then scroll to the API Keys section.
Click Reveal. Copy the displayed API key. To hide the API key, reload the page.
import wandb

wandb.init(project="visualize-sklearn") as run:

  y_pred = clf.predict(X_test)
  accuracy = sklearn.metrics.accuracy_score(y_true, y_pred)

  # If logging metrics over time, then use run.log
  run.log({"accuracy": accuracy})

  # OR to log a final metric at the end of training you can also use run.summary
  run.summary["accuracy"] = accuracy
Make plots
Step 1: Import wandb and initialize a new run
import wandb

run = wandb.init(project="visualize-sklearn")
Step 2: Visualize plots
Individual plots
After training a model and making predictions you can then generate plots in wandb to analyze your predictions. See the Supported Plots section below for a full list of supported charts.
# Visualize single plotwandb.sklearn.plot_confusion_matrix(y_true, y_pred, labels)
All plots
W&B has functions such as plot_classifier that will plot several relevant plots:
Plots created on Matplotlib can also be logged on W&B Dashboard. To do that, it is first required to install plotly.
pip install plotly
Finally, the plots can be logged on W&B’s dashboard as follows:
import matplotlib.pyplot as plt
import wandb
with wandb.init(project="visualize-sklearn") as run:
# do all the plt.plot(), plt.scatter(), etc. here.# ...# instead of doing plt.show() do: run.log({"plot": plt})
Supported plots
Learning curve
Trains model on datasets of varying lengths and generates a plot of cross validated scores vs dataset size, for both training and test sets.
wandb.sklearn.plot_learning_curve(model, X, y)
model (clf or reg): Takes in a fitted regressor or classifier.
X (arr): Dataset features.
y (arr): Dataset labels.
ROC
ROC curves plot true positive rate (y-axis) vs false positive rate (x-axis). The ideal score is a TPR = 1 and FPR = 0, which is the point on the top left. Typically we calculate the area under the ROC curve (AUC-ROC), and the greater the AUC-ROC the better.
wandb.sklearn.plot_roc(y_true, y_probas, labels)
y_true (arr): Test set labels.
y_probas (arr): Test set predicted probabilities.
labels (list): Named labels for target variable (y).
Class proportions
Plots the distribution of target classes in training and test sets. Useful for detecting imbalanced classes and ensuring that one class doesn’t have a disproportionate influence on the model.
labels (list): Named labels for target variable (y).
Precision recall curve
Computes the tradeoff between precision and recall for different thresholds. A high area under the curve represents both high recall and high precision, where high precision relates to a low false positive rate, and high recall relates to a low false negative rate.
High scores for both show that the classifier is returning accurate results (high precision), as well as returning a majority of all positive results (high recall). PR curve is useful when the classes are very imbalanced.
labels (list): Named labels for target variable (y).
Feature importances
Evaluates and plots the importance of each feature for the classification task. Only works with classifiers that have a feature_importances_ attribute, like trees.
feature_names (list): Names for features. Makes plots easier to read by replacing feature indexes with corresponding names.
Calibration curve
Plots how well calibrated the predicted probabilities of a classifier are and how to calibrate an uncalibrated classifier. Compares estimated predicted probabilities by a baseline logistic regression model, the model passed as an argument, and by both its isotonic calibration and sigmoid calibrations.
The closer the calibration curves are to a diagonal the better. A transposed sigmoid like curve represents an overfitted classifier, while a sigmoid like curve represents an underfitted classifier. By training isotonic and sigmoid calibrations of the model and comparing their curves we can figure out whether the model is over or underfitting and if so which calibration (sigmoid or isotonic) might help fix this.
wandb.sklearn.plot_calibration_curve(clf, X, y, 'RandomForestClassifier')
model (clf): Takes in a fitted classifier.
X (arr): Training set features.
y (arr): Training set labels.
model_name (str): Model name. Defaults to ‘Classifier’
Confusion matrix
Computes the confusion matrix to evaluate the accuracy of a classification. It’s useful for assessing the quality of model predictions and finding patterns in the predictions the model gets wrong. The diagonal represents the predictions the model got right, such as where the actual label is equal to the predicted label.
model (clf or reg): Takes in a fitted regressor or classifier.
X (arr): Training set features.
y (arr): Training set labels.
X_test (arr): Test set features.
y_test (arr): Test set labels.
Elbow plot
Measures and plots the percentage of variance explained as a function of the number of clusters, along with training times. Useful in picking the optimal number of clusters.
wandb.sklearn.plot_elbow_curve(model, X_train)
model (clusterer): Takes in a fitted clusterer.
X (arr): Training set features.
Silhouette plot
Measures & plots how close each point in one cluster is to points in the neighboring clusters. The thickness of the clusters corresponds to the cluster size. The vertical line represents the average silhouette score of all the points.
Silhouette coefficients near +1 indicate that the sample is far away from the neighboring clusters. A value of 0 indicates that the sample is on or very close to the decision boundary between two neighboring clusters and negative values indicate that those samples might have been assigned to the wrong cluster.
In general we want all silhouette cluster scores to be above average (past the red line) and as close to 1 as possible. We also prefer cluster sizes that reflect the underlying patterns in the data.
cluster_labels (list): Names for cluster labels. Makes plots easier to read by replacing cluster indexes with corresponding names.
Outlier candidates plot
Measures a datapoint’s influence on regression model via cook’s distance. Instances with heavily skewed influences could potentially be outliers. Useful for outlier detection.
Measures and plots the predicted target values (y-axis) vs the difference between actual and predicted target values (x-axis), as well as the distribution of the residual error.
Generally, the residuals of a well-fit model should be randomly distributed because good models will account for most phenomena in a data set, except for random error.
wandb.sklearn.plot_residuals(model, X, y)
model (regressor): Takes in a fitted classifier.
X (arr): Training set features.
y (arr): Training set labels.
If you have any questions, we’d love to answer them in our slack community.
Example
Run in colab: A simple notebook to get you started.
17 - Simple Transformers
How to integrate W&B with the Transformers library by Hugging Face.
This library is based on the Transformers library by Hugging Face. Simple Transformers lets you quickly train and evaluate Transformer models. Only 3 lines of code are needed to initialize a model, train the model, and evaluate a model. It supports Sequence Classification, Token Classification (NER),Question Answering,Language Model Fine-Tuning, Language Model Training, Language Generation, T5 Model, Seq2Seq Tasks , Multi-Modal Classification and Conversational AI.
To use W&B for visualizing model training. To use this, set a project name for W&B in the wandb_project attribute of the args dictionary. This logs all hyperparameter values, training losses, and evaluation metrics to the given project.
model = ClassificationModel('roberta', 'roberta-base', args={'wandb_project': 'project-name'})
Any additional arguments that go into wandb.init can be passed as wandb_kwargs.
Structure
The library is designed to have a separate class for every NLP task. The classes that provide similar functionality are grouped together.
simpletransformers.classification - Includes all Classification models.
ClassificationModel
MultiLabelClassificationModel
simpletransformers.ner - Includes all Named Entity Recognition models.
NERModel
simpletransformers.question_answering - Includes all Question Answering models.
QuestionAnsweringModel
Here are some minimal examples
MultiLabel Classification
  model = MultiLabelClassificationModel("distilbert","distilbert-base-uncased",num_labels=6,
    args={"reprocess_input_data": True, "overwrite_output_dir": True, "num_train_epochs":epochs,'learning_rate':learning_rate,
                'wandb_project': "simpletransformers"},
  )
   # Train the model
  model.train_model(train_df)

  # Evaluate the model
  result, model_outputs, wrong_predictions = model.eval_model(eval_df)
SimpleTransformers provides classes as well as training scripts for all common natural language tasks. Here is the complete list of global arguments that are supported by the library, with their default arguments.
spaCy is a popular “industrial-strength” NLP library: fast, accurate models with a minimum of fuss. As of spaCy v3, W&B can now be used with spacy train to track your spaCy model’s training metrics as well as to save and version your models and datasets. And all it takes is a few added lines in your configuration.
Sign up and create an API key
An API key authenticates your machine to W&B. You can generate an API key from your user profile.
For a more streamlined approach, you can generate an API key by going directly to the W&B authorization page. Copy the displayed API key and save it in a secure location such as a password manager.
Click your user profile icon in the upper right corner.
Select User Settings, then scroll to the API Keys section.
Click Reveal. Copy the displayed API key. To hide the API key, reload the page.
spaCy config files are used to specify all aspects of training, not just logging – GPU allocation, optimizer choice, dataset paths, and more. Minimally, under [training.logger] you need to provide the key @loggers with the value "spacy.WandbLogger.v3", plus a project_name.
For more on how spaCy training config files work and on other options you can pass in to customize training, check out spaCy’s documentation.
str. The name of the W&B Project. The project will be created automatically if it doesn’t exist yet.
remove_config_values
List[str] . A list of values to exclude from the config before it is uploaded to W&B. [] by default.
model_log_interval
Optional int. None by default. If set, enables model versioning with Artifacts. Pass in the number of steps to wait between logging model checkpoints. None by default.
log_dataset_dir
Optional str. If passed a path, the dataset will be uploaded as an Artifact at the beginning of training. None by default.
entity
Optional str . If passed, the run will be created in the specified entity
run_name
Optional str . If specified, the run will be created with the specified name.
Start training
Once you have added the WandbLogger to your spaCy training config you can run spacy train as usual.
When training begins, a link to your training run’s W&B page will be output which will take you to this run’s experiment tracking dashboard in the W&B web UI.
W&B support embedded TensorBoard for W&B Multi-tenant SaaS.
Upload your TensorBoard logs to the cloud, quickly share your results among colleagues and classmates and keep your analysis in one centralized location.
Get started
import wandb
# Start a wandb run with `sync_tensorboard=True`wandb.init(project="my-project", sync_tensorboard=True) as run:
# Your training code using TensorBoard...
Once your run finishes, you can access your TensorBoard event files in W&B and you can visualize your metrics in native W&B charts, together with additional useful information like the system’s CPU or GPU utilization, the git state, the terminal command the run used, and more.
W&B supports TensorBoard with all versions of TensorFlow. W&B also supports TensorBoard 1.14 and higher with PyTorch as well as TensorBoardX.
Frequently asked questions
How can I log metrics to W&B that aren’t logged to TensorBoard?
If you need to log additional custom metrics that aren’t being logged to TensorBoard, you can call wandb.Run.log() in your code run.log({"custom": 0.8})
Setting the step argument in run.log() is turned off when syncing Tensorboard. If you’d like to set a different step count, you can log the metrics with a step metric as:
How do I configure Tensorboard when I’m using it with wandb?
If you want more control over how TensorBoard is patched you can call wandb.tensorboard.patch instead of passing sync_tensorboard=True to wandb.init.
import wandb
wandb.tensorboard.patch(root_logdir="<logging_directory>")
run = wandb.init()
# Finish the wandb run to upload the tensorboard logs to W&B (if running in Notebook)run.finish()
You can pass tensorboard_x=False to this method to ensure vanilla TensorBoard is patched, if you’re using TensorBoard > 1.14 with PyTorch you can pass pytorch=True to ensure it’s patched. Both of these options have smart defaults depending on what versions of these libraries have been imported.
By default, we also sync the tfevents files and any .pbtxt files. This enables us to launch a TensorBoard instance on your behalf. You will see a TensorBoard tab on the run page. This behavior can be turned off by passing save=False to wandb.tensorboard.patch
import wandb
run = wandb.init()
wandb.tensorboard.patch(save=False, tensorboard_x=True)
# If running in a notebook, finish the wandb run to upload the tensorboard logs to W&Brun.finish()
You must call either wandb.init() or wandb.tensorboard.patchbefore calling tf.summary.create_file_writer or constructing a SummaryWriter via torch.utils.tensorboard.
How do I sync historical TensorBoard runs?
If you have existing tfevents files stored locally and you would like to import them into W&B, you can run wandb sync log_dir, where log_dir is a local directory containing the tfevents files.
How do I use Google Colab or Jupyter with TensorBoard?
If running your code in a Jupyter or Colab notebook, make sure to call wandb.Run.finish() and the end of your training. This will finish the wandb run and upload the tensorboard logs to W&B so they can be visualized. This is not necessary when running a .py script as wandb finishes automatically when a script finishes.
To run shell commands in a notebook environment, you must prepend a !, as in !wandb sync directoryname.
How do I use PyTorch with TensorBoard?
If you use PyTorch’s TensorBoard integration, you may need to manually upload the PyTorch Profiler JSON file.
with wandb.init(project="my-project", sync_tensorboard=True) as run:
    run.save(glob.glob(f"runs/*.pt.trace.json")[0], base_path=f"runs")
Can I sync tfevents files stored in the cloud?
wandb 0.20.0 and above supports syncing tfevents files stored in S3, GCS or Azure. wandb uses the default credentials for each cloud provider, corresponding to the commands in the following table:
If you’re already using TensorBoard, it’s easy to integrate with wandb.
import tensorflow as tf
import wandb
Log custom metrics
If you need to log additional custom metrics that aren’t being logged to TensorBoard, you can call run.log() in your code run.log({"custom": 0.8})
Setting the step argument in run.log() is turned off when syncing Tensorboard. If you’d like to set a different step count, you can log the metrics with a step metric as:
with wandb.init(config=tf.flags.FLAGS, sync_tensorboard=True) as run:
    run.log({"custom": 0.8, "global_step":global_step}, step=global_step)
TensorFlow estimators hook
If you want more control over what gets logged, wandb also provides a hook for TensorFlow estimators. It will log all tf.summary values in the graph.
import tensorflow as tf
import wandb

run = wandb.init(config=tf.FLAGS)

estimator.train(hooks=[wandb.tensorflow.WandbHook(steps_per_log=1000)])
run.finish()
Log manually
The simplest way to log metrics in TensorFlow is by logging tf.summary with the TensorFlow logger:
import wandb
run = wandb.init(config=tf.flags.FLAGS, sync_tensorboard=True)
with tf.Session() as sess:
    # ...
    wandb.tensorflow.log(tf.summary.merge_all())
With TensorFlow 2, the recommended way of training a model with a custom loop is via using tf.GradientTape. You can read more in the TensorFlow custom training walkthrough. If you want to incorporate wandb to log metrics in your custom TensorFlow training loops you can follow this snippet:
    with tf.GradientTape() as tape:
        # Get the probabilities
        predictions = model(features)
        # Calculate the loss
        loss = loss_func(labels, predictions)

    # Log your metrics
    run.log("loss": loss.numpy())
    # Get the gradients
    gradients = tape.gradient(loss, model.trainable_variables)
    # Update the weights
    optimizer.apply_gradients(zip(gradients, model.trainable_variables))
When the cofounders started working on W&B, they were inspired to build a tool for the frustrated TensorBoard users at OpenAI. Here are a few things we’ve focused on improving:
Reproduce models: W&B is good for experimentation, exploration, and reproducing models later. We capture not just the metrics, but also the hyperparameters and version of the code, and we can save your version-control status and model checkpoints for you so your project is reproducible.
Automatic organization: Whether you’re picking up a project from a collaborator, coming back from a vacation, or dusting off an old project, W&B makes it easy to see all the models that have been tried so no one wastes hours, GPU cycles, or carbon re-running experiments.
Fast, flexible integration: Add W&B to your project in 5 minutes. Install our free open-source Python package and add a couple of lines to your code, and every time you run your model you’ll have nice logged metrics and records.
Persistent, centralized dashboard: No matter where you train your models, whether on your local machine, in a shared lab cluster, or on spot instances in the cloud, your results are shared to the same centralized dashboard. You don’t need to spend your time copying and organizing TensorBoard files from different machines.
Powerful tables: Search, filter, sort, and group results from different models. It’s easy to look over thousands of model versions and find the best performing models for different tasks. TensorBoard isn’t built to work well on large projects.
Tools for collaboration: Use W&B to organize complex machine learning projects. It’s easy to share a link to W&B, and you can use private teams to have everyone sending results to a shared project. We also support collaboration via reports— add interactive visualizations and describe your work in markdown. This is a great way to keep a work log, share findings with your supervisor, or present findings to your lab or team.
The wandb library has a WandbCallback callback for logging metrics, configs and saved boosters from training with XGBoost. Here you can see a live W&B Dashboard with outputs from the XGBoost WandbCallback.
Get started
Logging XGBoost metrics, configs and booster models to W&B is as easy as passing the WandbCallback to XGBoost:
from wandb.integration.xgboost import WandbCallback
import xgboost as XGBClassifier
...# Start a wandb runwith wandb.init() as run:
# Pass WandbCallback to the model bst = XGBClassifier()
bst.fit(X_train, y_train, callbacks=[WandbCallback(log_model=True)])
You can open this notebook for a comprehensive look at logging with XGBoost and W&B
WandbCallback reference
Functionality
Passing WandbCallback to a XGBoost model will:
log the booster model configuration to W&B
log evaluation metrics collected by XGBoost, such as rmse, accuracy etc to W&B
log training metrics collected by XGBoost (if you provide data to eval_set)
log the best score and the best iteration
save and upload your trained model to W&B Artifacts (when log_model = True)
log feature importance plot when log_feature_importance=True (default).
Capture the best eval metric in wandb.Run.summary when define_metric=True (default).
Arguments
log_model: (boolean) if True save and upload the model to W&B Artifacts
log_feature_importance: (boolean) if True log a feature importance bar plot
importance_type: (str) one of {weight, gain, cover, total_gain, total_cover} for tree model. weight for linear model.
define_metric: (boolean) if True (default) capture model performance at the best step, instead of the last step, of training in your run.summary.
Attaining the maximum performance out of models requires tuning hyperparameters, like tree depth and learning rate. W&B Sweeps is a powerful toolkit for configuring, orchestrating, and analyzing large hyperparameter testing experiments.
Ultralytics’ YOLOv5 (“You Only Look Once”) model family enables real-time object detection with convolutional neural networks without all the agonizing pain.
W&B is directly integrated into YOLOv5, providing experiment metric tracking, model and dataset versioning, rich model prediction visualization, and more. It’s as easy as running a single pip install before you run your YOLO experiments.
All W&B logging features are compatible with data-parallel multi-GPU training, such as with PyTorch DDP.
Track core experiments
Simply by installing wandb, you’ll activate the built-in W&B logging features: system metrics, model metrics, and media logged to interactive Dashboards.
pip install wandb
git clone https://github.com/ultralytics/yolov5.git
python yolov5/train.py  # train a small network on a small dataset
Just follow the links printed to the standard out by wandb.
Customize the integration
By passing a few simple command line arguments to YOLO, you can take advantage of even more W&B features.
If you pass a number to --save_period, W&B saves a model version at the end of every save_period epochs. The model version includes the model weights and tags the best-performing model in the validation set.
Turning on the --upload_dataset flag will also upload the dataset for data versioning.
Passing a number to --bbox_interval will turn on data visualization. At the end of every bbox_interval epochs, the outputs of the model on the validation set will be uploaded to W&B.
Every W&B account comes with 100 GB of free storage for datasets and models.
Here’s what that looks like.
With data and model versioning, you can resume paused or crashed experiments from any device, no setup necessary. Check out the Colab for details.
23 - YOLOX
How to integrate W&B with YOLOX.
YOLOX is an anchor-free version of YOLO with strong performance for object detection. You can use the YOLOX W&B integration to turn on logging of metrics related to training, validation, and the system, and you can interactively validate predictions with a single command-line argument.
Sign up and create an API key
An API key authenticates your machine to W&B. You can generate an API key from your user profile.
For a more streamlined approach, you can generate an API key by going directly to the W&B authorization page. Copy the displayed API key and save it in a secure location such as a password manager.
Click your user profile icon in the upper right corner.
Select User Settings, then scroll to the API Keys section.
Click Reveal. Copy the displayed API key. To hide the API key, reload the page.
Use the --logger wandb command line argument to turn on logging with wandb. Optionally you can also pass all of the arguments that wandb.init() expects; prepend each argument with wandb-.
num_eval_imges controls the number of validation set images and predictions that are logged to W&B tables for model evaluation.
# login to wandbwandb login
# call your yolox training script with the `wandb` logger argumentpython tools/train.py .... --logger wandb \
wandb-project <project-name> \
wandb-entity <entity>
wandb-name <run-name> \
wandb-id <run-id> \
wandb-save_dir <save-dir> \
wandb-num_eval_imges <num-images> \
wandb-log_checkpoints <bool>